
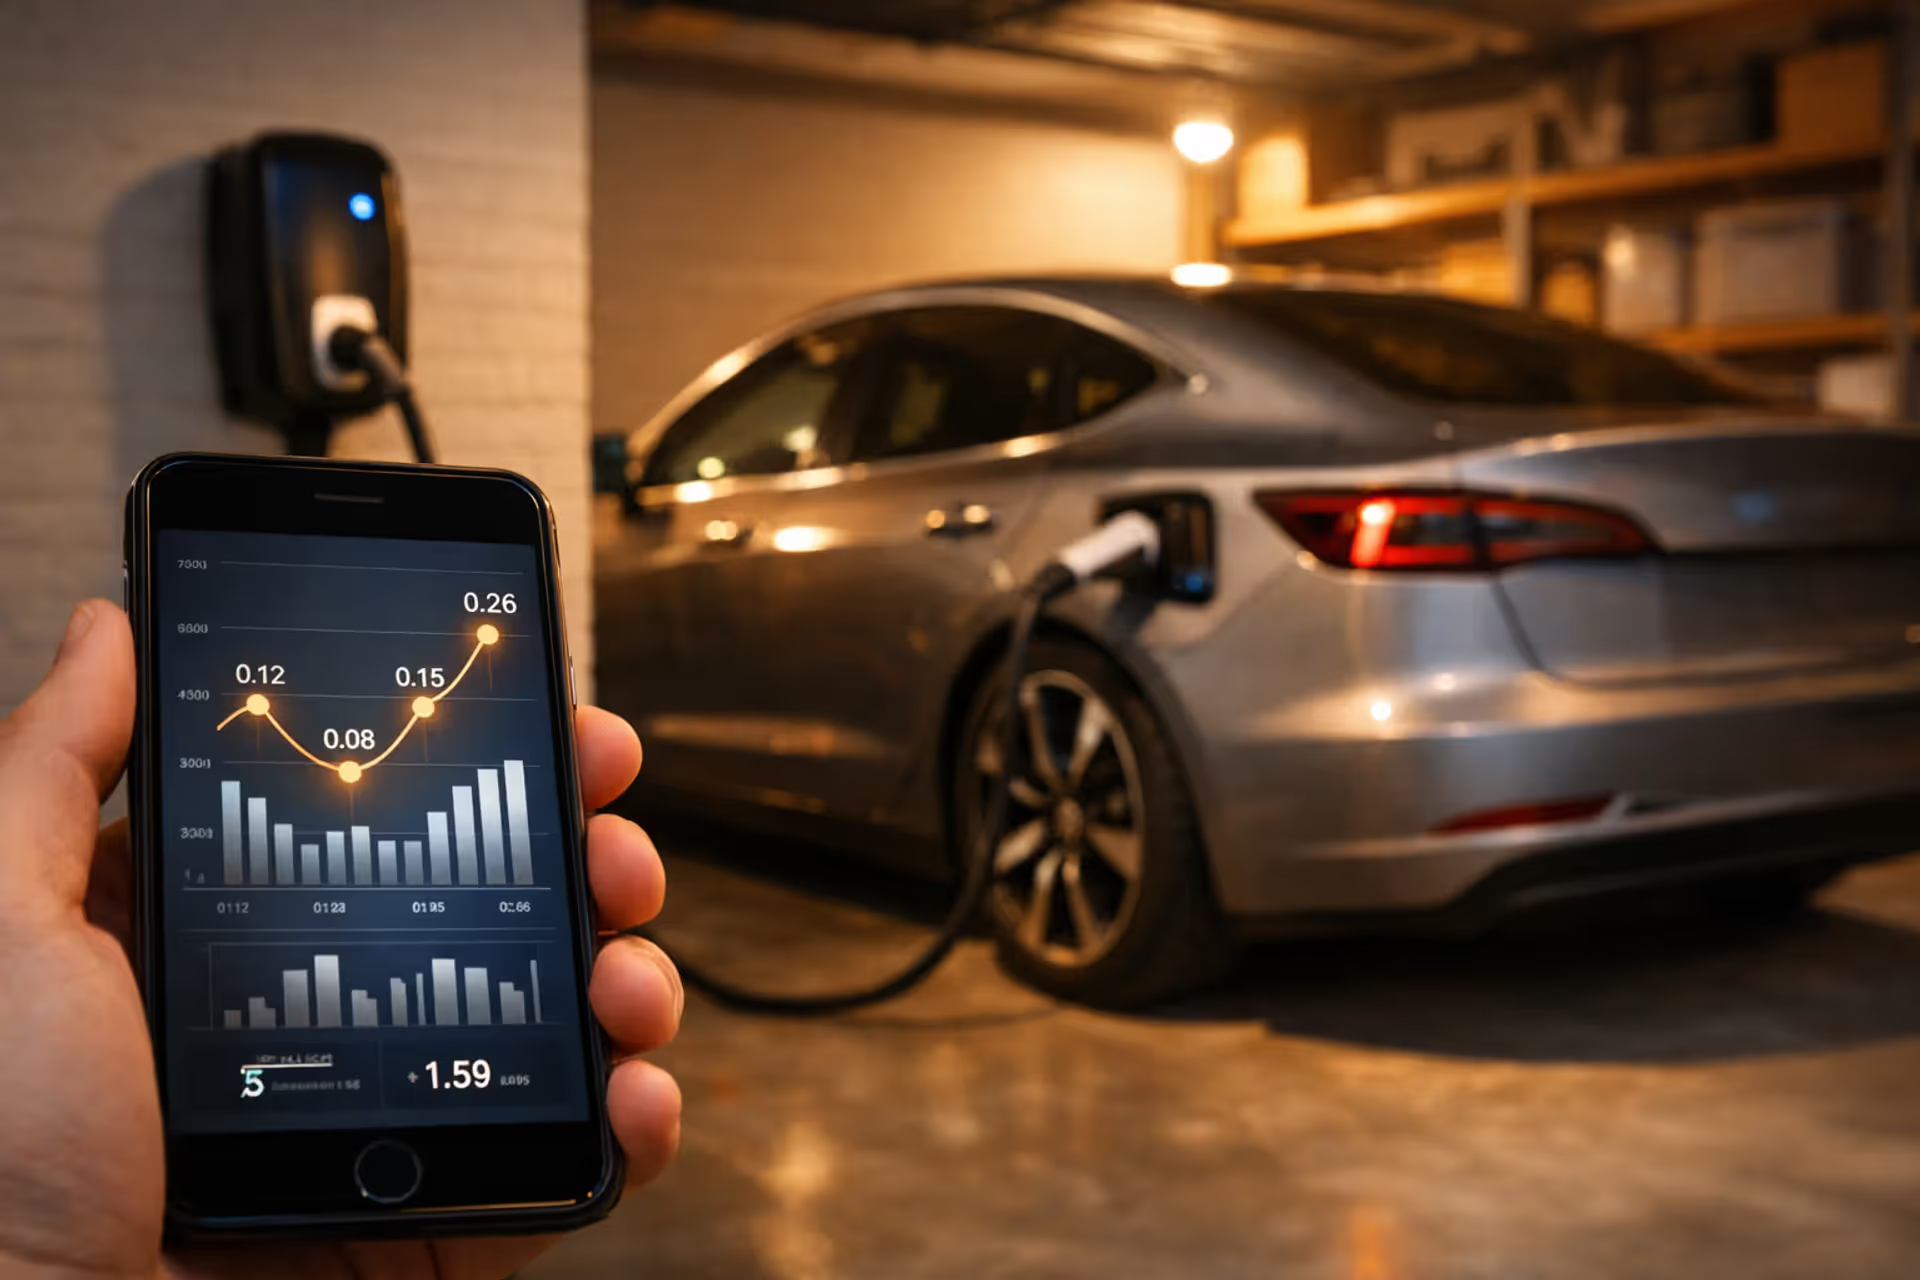
Electric vehicle plugged into home Level 2 charging station in residential garage with smartphone displaying charging cost calculator app
How EV Charging Cost Calculator Logic Works: The Math Behind Your Charging Expenses

You've probably seen those online calculators promising to estimate your EV charging costs. Punch in a few numbers, get a monthly figure. Sounds simple, right?
Except when your first electricity bill arrives and you're staring at charges 40% higher than predicted. Or you're trying to justify an EV purchase to a skeptical spouse, and the calculator shows savings that seem too good to be true (because they are).
Here's what's actually happening: Most calculators use oversimplified assumptions—perfect weather, flawless charging discipline, ideal conditions your real-world driving will never match. Someone who charges exclusively at 2 AM under a special utility program might hit those rosy projections. Someone plugging in after dinner at standard rates? Not even close.
This guide breaks down exactly how these calculators should work, what they're missing, and how to build accurate estimates for your actual situation.
Core Variables That Drive EV Charging Cost Calculations
Four numbers form the foundation of any legitimate charging cost estimate. Get these wrong, and everything downstream falls apart.
Battery capacity tells you storage size in kilowatt-hours (kWh). The Tesla Model 3 Standard Range stores 57.5 kWh. The GMC Hummer EV? A massive 212 kWh. Bigger isn't always costlier per mile, though. A giant battery in an efficient vehicle beats a small battery in an energy hog.
Vehicle efficiency—measured in kWh per 100 miles—matters far more than battery size. The Hyundai Ioniq 6 sips just 24 kWh/100mi. A Rivian R1T truck gulps down 50+ kWh/100mi. Same distance, double the electricity cost.
Electricity rates vary wildly by location and plan type. The US residential average sits around $0.16/kWh. But averages hide everything interesting. California drivers often pay $0.30 or more. Louisiana? Under $0.10/kWh. Your specific rate plan—whether flat, tiered, or time-based—completely changes your calculation approach.
Charging speed affects costs through efficiency losses and pricing models. A standard 120V outlet (Level 1) charges slowly but wastes less energy. A 240V home charger (Level 2) strikes a practical balance. DC fast charging delivers speed but costs more and introduces higher conversion losses.
Here's what the numbers look like across popular models:
| Vehicle Model | Battery Capacity (kWh) | EPA Efficiency (kWh/100mi) | Cost per 100 miles @ $0.14/kWh |
| Hyundai Ioniq 6 (RWD) | 77.4 | 24 | $3.36 |
| Tesla Model 3 (RWD) | 57.5 | 25 | $3.50 |
| Ford Mustang Mach-E (RWD) | 70 | 30 | $4.20 |
| Chevrolet Silverado EV | 200 | 45 | $6.30 |
| Rivian R1T (Dual Motor) | 135 | 51 | $7.14 |
Notice the Silverado's 200 kWh battery doesn't translate to economy. Truck aerodynamics and weight push consumption high enough that it costs more than double the Ioniq 6 per 100 miles.
Electricity Pricing Models and Rate Structures for EV Owners
Your utility's pricing structure determines whether calculators will predict your costs accurately or mislead you completely. Too many EV buyers discover this after their first shocking bill.
Flat-rate plans charge identical prices regardless of timing. Calculation stays straightforward: vehicle efficiency times your rate divided by 100. A car using 28 kWh/100mi at $0.15/kWh costs $4.20 per 100 miles. Easy math. These plans work fine if you're a light EV user but penalize heavy charging.
Tiered pricing increases your per-kWh cost as you consume more electricity each month. Your first 500 kWh might run $0.12/kWh. Everything above that? Suddenly $0.18/kWh. Adding an EV often pushes households into expensive upper tiers. Calculators using base rates can underestimate by 20-40% for tiered customers.
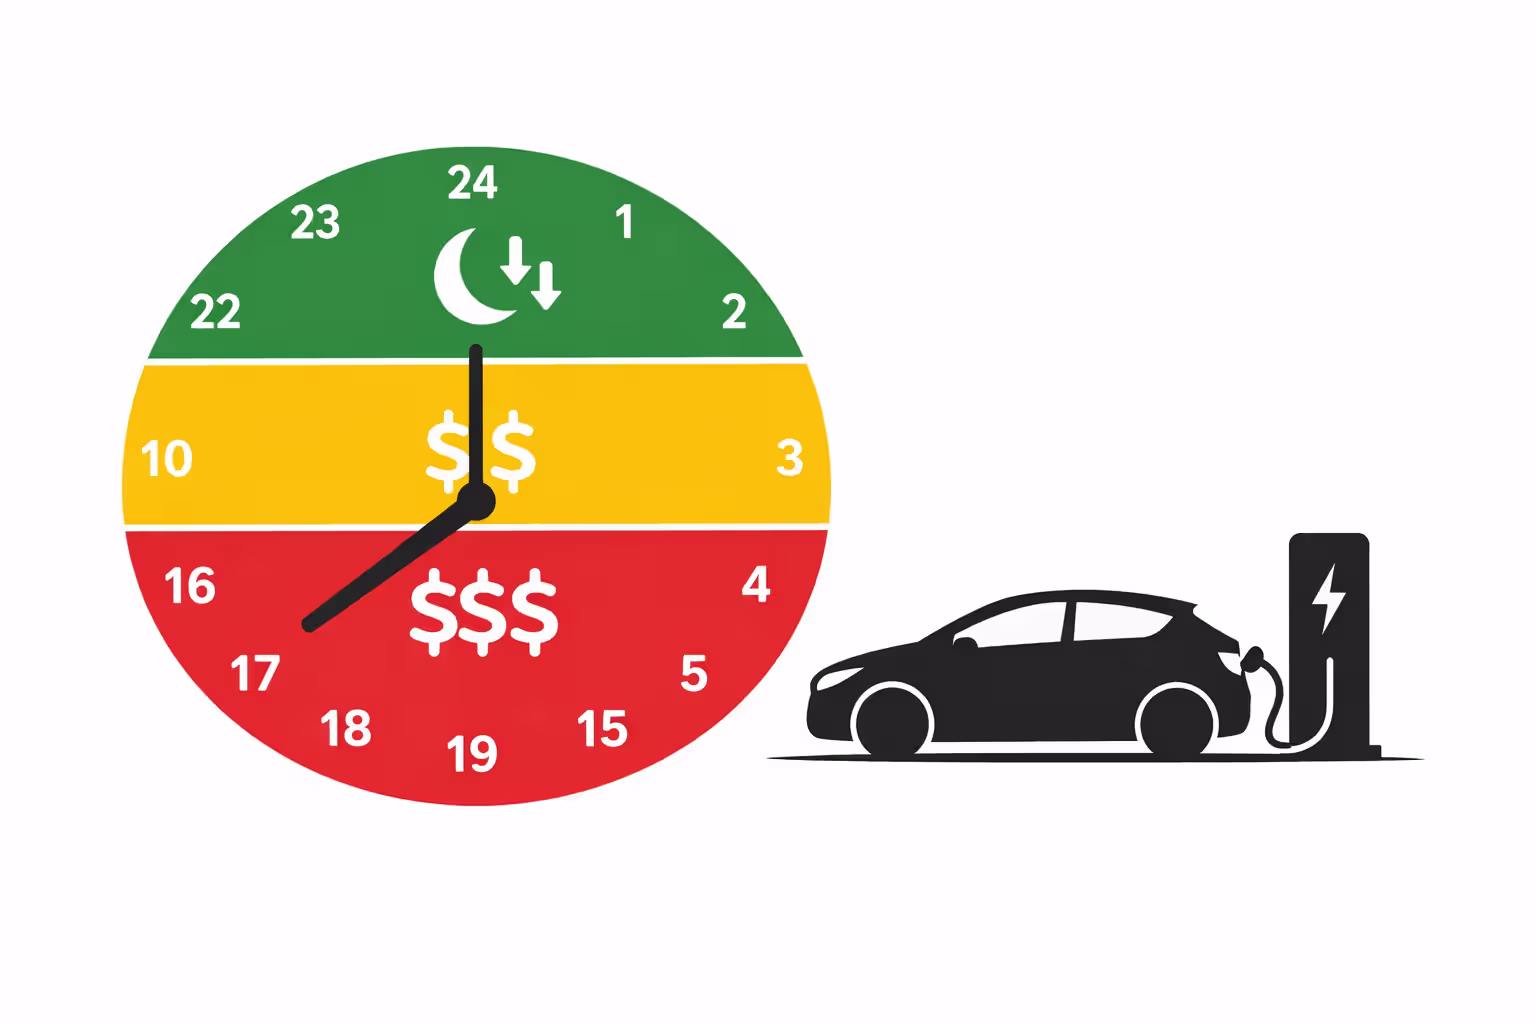
Time-of-use plans vary rates by clock hours. Three typical periods: peak (expensive), mid-peak (moderate), off-peak (cheap). The spread can be dramatic—$0.40/kWh versus $0.08/kWh in some markets.
Author: Kevin Thornton;
Source: shafer-motorsports.com
How Time-of-Use Rates Change Your Charging Math
TOU plans reward patient people. Charge that 75 kWh battery from 20% to 80%—that's 45 kWh of actual charging—and watch timing create wildly different costs:
- Peak hours (4-9 PM): 45 kWh × $0.38/kWh = $17.10
- Off-peak hours (11 PM-7 AM): 45 kWh × $0.09/kWh = $4.05
Thirteen dollars difference. For one charging session. Two charges weekly over a year? You're looking at $1,352 in savings just from plugging in before bed instead of right after work.
There's a catch, naturally. TOU plans often raise daytime rates to subsidize cheap overnight power. Run your air conditioner, cook dinner, do laundry during peak hours? Your non-EV electricity costs might spike enough to erase EV savings. Smart calculators account for total household patterns, not just vehicle charging in isolation.
Demand Charges at Public Stations: The Hidden Cost Factor
Public networks introduce complexity that home-focused calculators conveniently ignore. Residential customers pay only for energy consumed. Commercial rates often include demand charges—fees based on peak power draw during a billing cycle.
DC fast chargers pulling 150-350 kW create enormous demand spikes. Networks pay demand charges reaching hundreds monthly per charger. They recover these costs through pricing structures that confuse simple calculators.
Some networks charge per kWh (similar to home rates). Others charge per minute (penalizing vehicles with slower charging curves). Still others mix both approaches. Electrify America typically charges $0.43-$0.48/kWh for non-members. EVgo uses per-minute pricing in certain regions: $0.32/minute regardless of actual power delivery.
A calculator claiming to show "public charging costs" needs to specify which network, membership tier, and pricing model. Otherwise it's just guessing. Different networks can vary 50% or more for identical sessions.
Building the Cost-Per-Mile Formula for Electric Vehicles
The basic formula looks simple. Applying it correctly? That's where things get interesting.
Basic formula: (Vehicle efficiency in kWh/100mi ÷ 100) × Electricity rate per kWh = Cost per mile
Take a vehicle rated at 30 kWh/100mi with electricity at $0.15/kWh: (30 ÷ 100) × $0.15 = $0.045 per mile
Multiply by annual mileage for yearly totals: $0.045 × 12,000 miles = $540/year
Works great for perfect conditions. Real world? Not so much.
Adjusted formula: ((Vehicle efficiency ÷ Charging efficiency) ÷ 100) × Electricity rate = Actual cost per mile
Assume 90% charging efficiency—10% gets lost as heat: ((30 ÷ 0.90) ÷ 100) × $0.15 = $0.05 per mile
That 10% loss adds $60 annually. Not catastrophic, but it compounds over ownership.
For mixed charging scenarios (home plus occasional fast charging), weighted averages become necessary:
Mixed charging formula: (Home miles × Home rate × Home efficiency) + (Public miles × Public rate × Public efficiency) = Total cost
Real example: 10,000 home miles, 2,000 fast-charging miles - Home portion: (10,000 miles × $0.045/mi) = $450 - Public portion: (2,000 miles × $0.12/mi) = $240 - Total annual: $690
Those public charging miles cost almost three times as much per mile. Regular fast charging use significantly damages EV economics.
The first rule of truly understanding your electric vehicle costs is to measure what actually comes out of your wall socket, not what the EPA sticker promises
— Sandy Munro
Home Charging vs. Public Charging: Cost Comparison Logic
Where you plug in creates the biggest variable in actual costs. Calculators mixing home and public scenarios without distinction produce meaningless averages.
Home Level 2 charging delivers the best economics for most owners. After initial installation ($500-$2,000 for equipment and electrical work), you're paying residential electricity rates. Overnight charging on an off-peak TOU plan can hit $0.02-0.03 per mile—cheaper than any gasoline option.
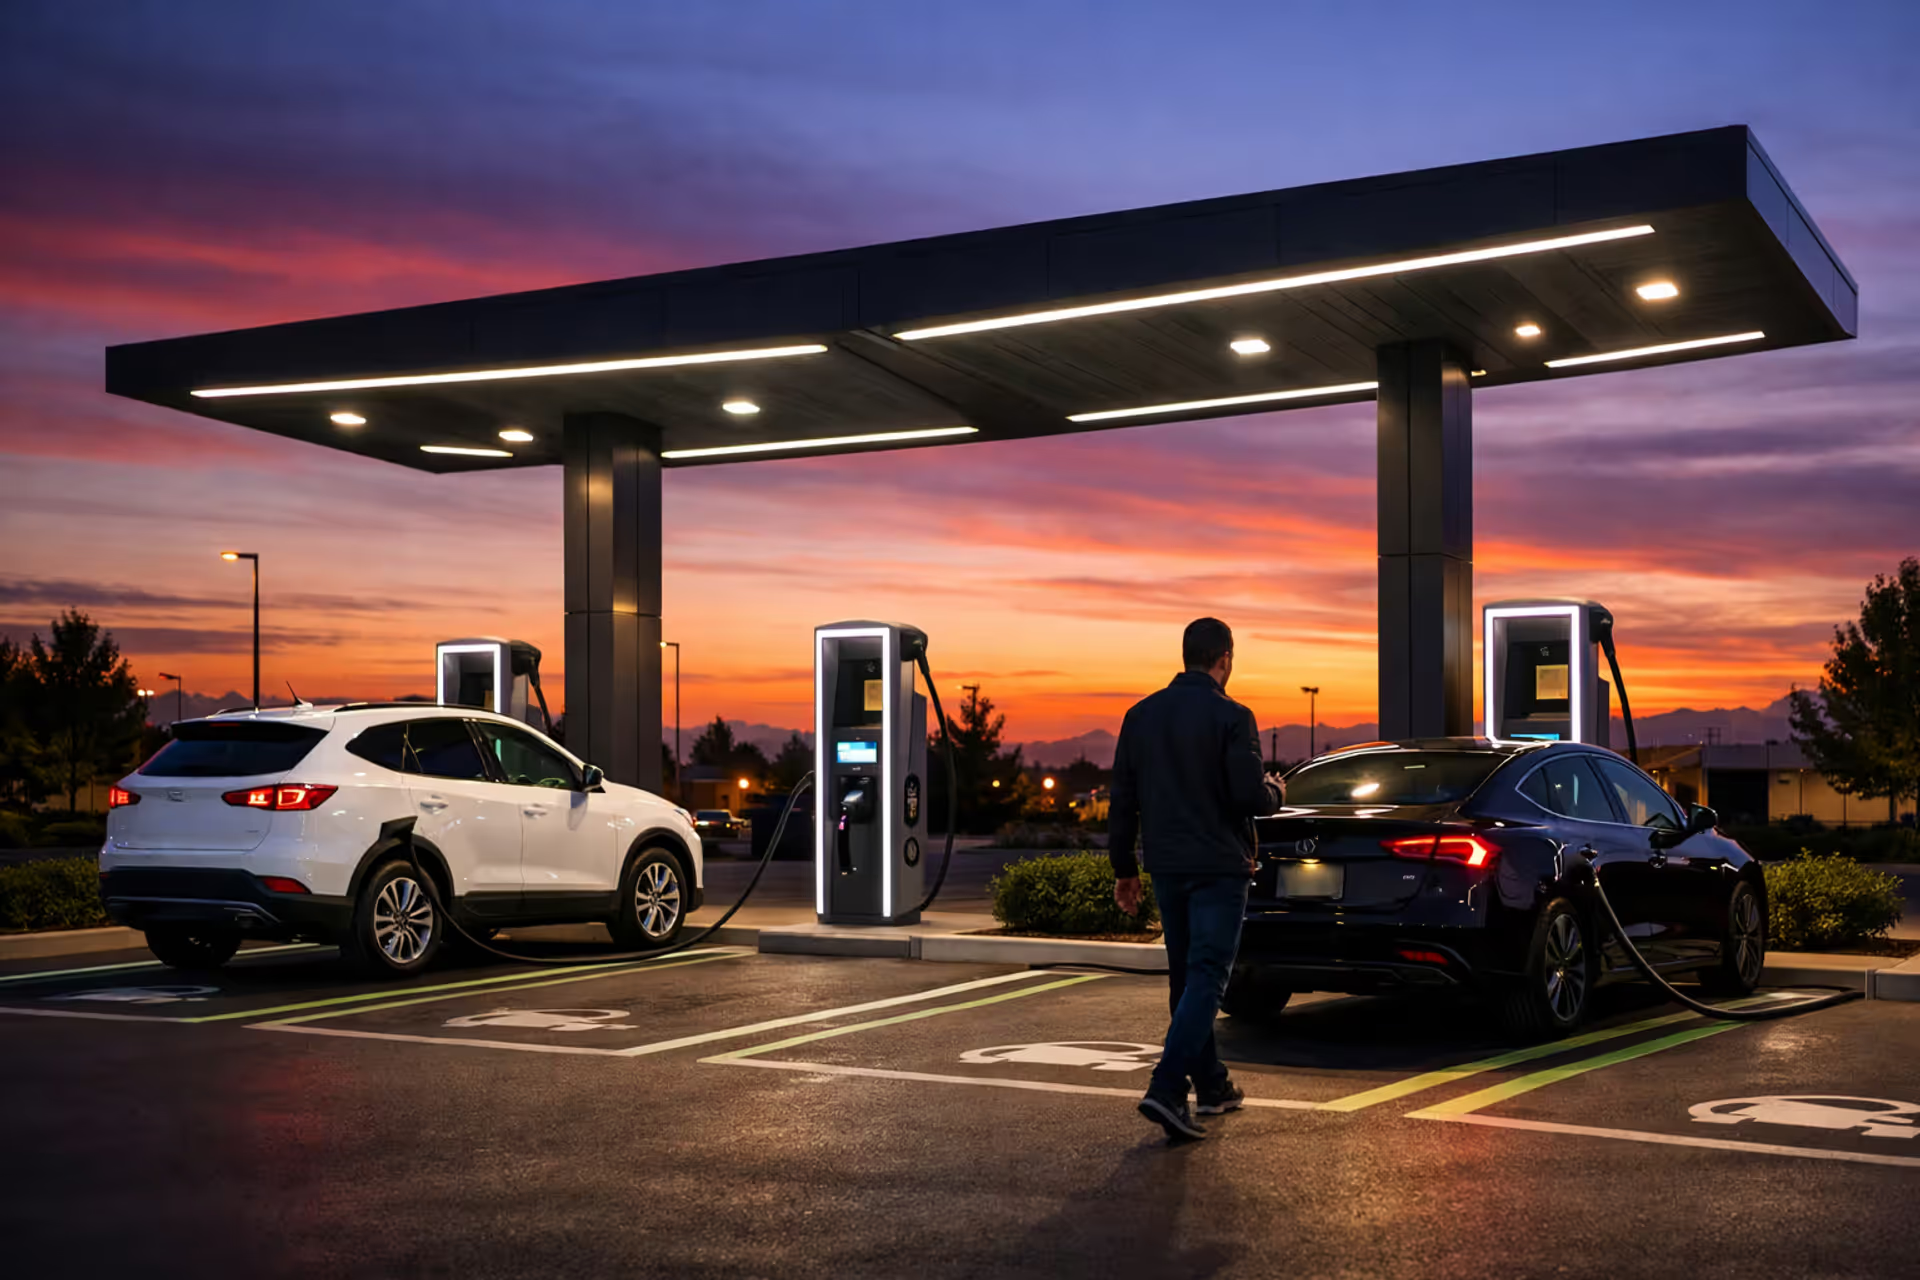
Public Level 2 charging (malls, parking garages) typically runs $0.20-0.35/kWh or $1-3 hourly. Fine for topping off during errands. Terrible for regular use. At $0.30/kWh, a 30 kWh/100mi vehicle costs $0.09/mile—triple your home off-peak rate.
DC fast charging trades convenience for premium pricing. At $0.45/kWh, that same vehicle hits $0.135/mile—4.5 times your home rate. Makes sense for road trips. Destroys EV ownership economics if you're fast charging twice weekly.
Let's compare actual numbers for a vehicle consuming 30 kWh/100mi with 90% charging efficiency:
| Charging Type | Rate Structure | Cost per kWh | 100-Mile Cost | Monthly (1,000 mi) |
| Home off-peak | Time-of-use | $0.09/kWh | $2.70 | $27 |
| Home peak hours | Time-of-use | $0.32/kWh | $9.60 | $96 |
| Public Level 2 | Per kWh or hourly | $0.28/kWh | $8.40 | $84 |
| DC fast charging | Per kWh or minute | $0.45/kWh | $13.50 | $135 |
That home installation cost deserves separate consideration. A $1,500 Level 2 setup amortized over ten years adds $12.50 monthly. Many calculators skip this, making home charging appear cheaper than reality during early ownership years.
Peak vs. Off-Peak Charging: Calculating Time-Based Savings
Time-of-use plans make or break EV economics. The arithmetic is elementary. Maintaining charging discipline? Much harder.
Consider someone driving 1,000 miles monthly in a vehicle consuming 28 kWh/100mi. That's 280 kWh of charging demand. Factor in 90% charging efficiency, and you're pulling 311 kWh from the wall.
Peak charging (6-9 PM at $0.36/kWh): 311 kWh × $0.36 = $112/month = $1,344/year
Off-peak charging (11 PM-6 AM at $0.10/kWh): 311 kWh × $0.10 = $31/month = $372/year
Annual savings from plugging in before bed instead of immediately after work: $972
Nearly a thousand dollars yearly from charging discipline alone. Over typical eight-year EV ownership, timing saves $7,776—often enough to offset depreciation differences versus comparable gas models.
What about partial off-peak charging? Life happens. You forget occasionally. Weekend schedules differ. Unexpected trips require quick top-ups.
If you manage 70% off-peak and 30% peak charging:
(0.70 × 311 kWh × $0.10) + (0.30 × 311 kWh × $0.36) = $21.77 + $33.59 = $55.36/month
Still beats full peak charging, but you're leaving $24 monthly ($288 yearly) on the table versus perfect off-peak discipline.
Smart chargers and vehicle scheduling features help maximize off-peak charging automatically. A $400 smart charger pays for itself in 16 months if it prevents 50% peak-hour charging.

Author: Kevin Thornton;
Source: shafer-motorsports.com
Accounting for Charging Efficiency Loss in Your Calculations
Every charging session wastes energy converting AC power to DC for battery storage. Ignoring these losses makes estimates 10-25% too optimistic.
Charging efficiency varies by method: - Level 1 (120V): 85-90% efficient - Level 2 (240V): 88-94% efficient
- DC fast charging: 90-95% efficient (battery heating can reduce this)
Charge a 75 kWh battery via Level 2 at 90% efficiency. Your meter actually records 83.3 kWh. At $0.15/kWh, you're paying $12.50, not the $11.25 that battery capacity suggests.
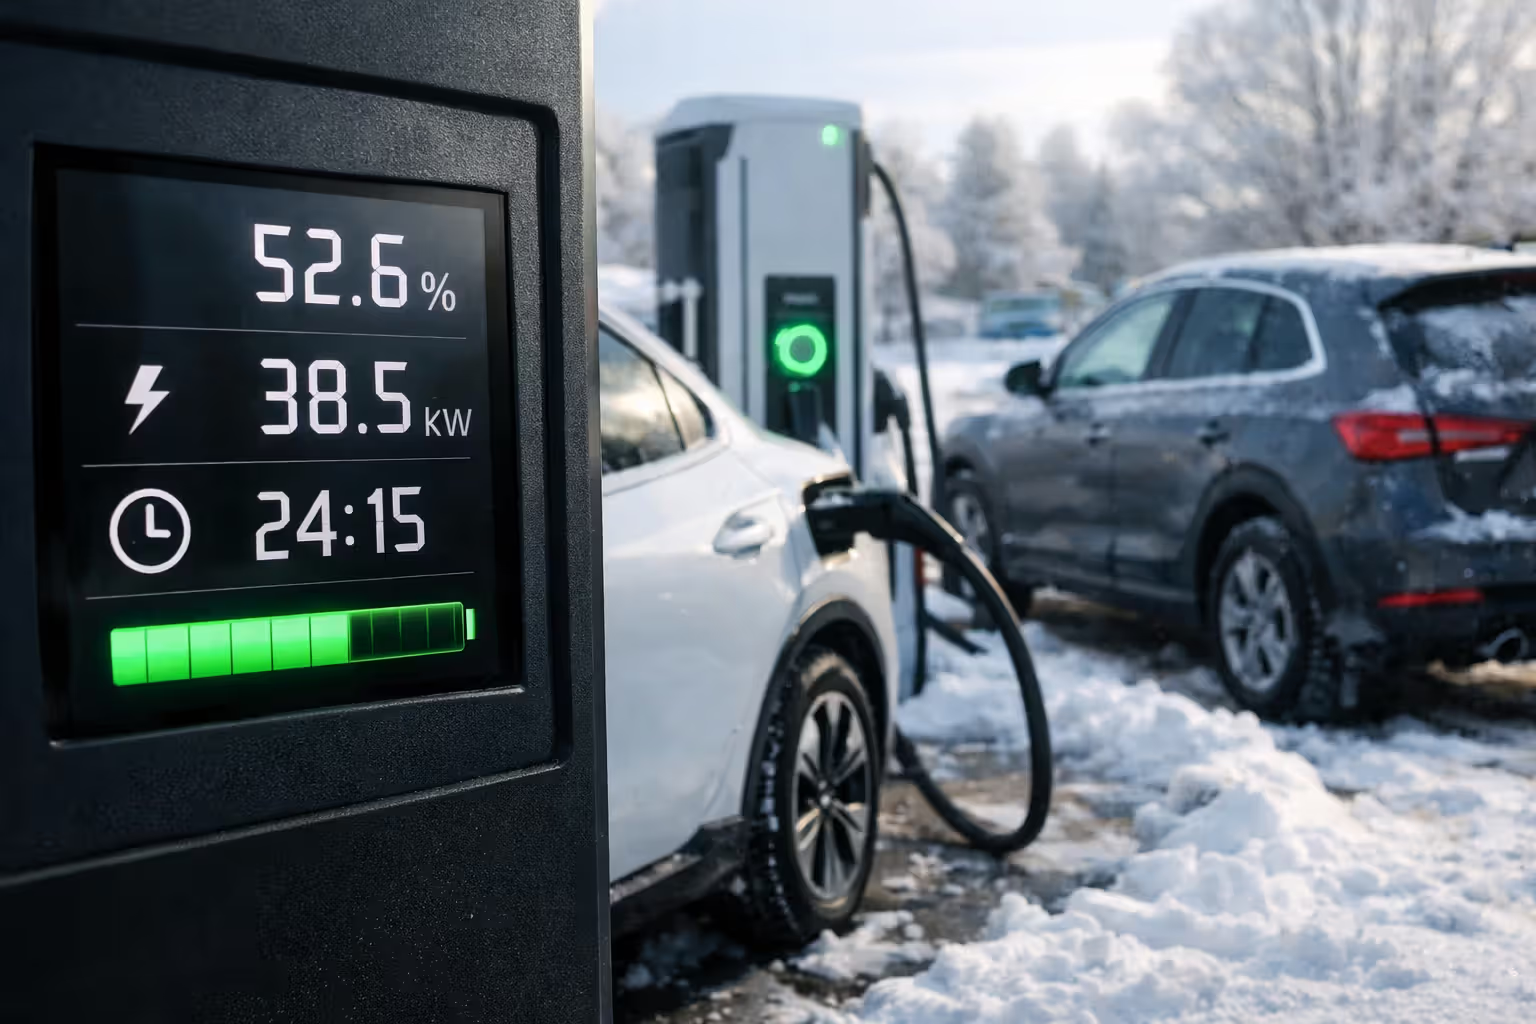
Temperature wreaks havoc on charging efficiency. Cold weather can drop efficiency to 70-80% as the system heats the battery pack. Your theoretical $11.25 charge might cost $15+ on a January morning in Minnesota.
This "wall-to-wheel" measurement matters far more than EPA ratings alone. A vehicle rated 28 kWh/100mi might actually consume 32 kWh from your wall per 100 miles after losses. Calculators showing only EPA figures consistently underestimate real costs.
Vampire drain—energy your parked EV uses maintaining battery temperature and running computers—adds another 1-3% to costs. A vehicle sitting unused for a week might lose 2-3 kWh, costing $0.30-0.45. Sounds trivial. Annual vampire drain adds $20-40 for vehicles with poor standby efficiency.
Accurate calculators should include an efficiency factor input. Default to 90% for Level 2 charging. Allow adjustment for cold climates (85%) or ideal conditions (92-94%).
In energy economics, the difference between theoretical efficiency and real-world efficiency is where all the money hides
— Ramez Naam
Common Mistakes That Break EV Cost Calculator Accuracy
Even sophisticated calculators fail when making these problematic assumptions:
Ignoring seasonal variation. Winter driving can slash range 30-40% in cold climates through cabin heating and battery chemistry changes. A calculator projecting $40 monthly may be accurate for June but underestimate December by $15-20. Annual estimates need weighted averages reflecting local climate, not EPA ratings from controlled testing.
Assuming perfect off-peak compliance. Reality intrudes. Forgotten plug-ins. Late arrivals home. Unexpected trips requiring quick top-ups. Real charging patterns rarely achieve 100% off-peak charging. Calculators should assume 70-80% off-peak compliance for typical users, not perfect behavior.
Overlooking idle fees. Many DC fast networks charge $0.40-1.00 per minute after charging completes if you haven't moved your vehicle. A 30-minute charge followed by 15 minutes shopping? That's $6-15 added to your cost. Frequent fast-charging users pay hundreds annually in idle fees that basic calculators completely ignore.
Treating Level 1 and Level 2 identically. Both home options cost the same per kWh. Level 1 takes 3-4 times longer, increasing vampire drain losses. The convenience gap is enormous, yet some calculators treat them as interchangeable.
Using outdated electricity rates. Utility rates change annually, typically increasing 3-5%. A calculator built with 2022 rates might underestimate 2024 costs by 10%. Always verify current rate schedules before trusting estimates.
Forgetting commercial demand charges. Business owners installing workplace charging face demand charges residential calculators don't account for. Small businesses might pay $200+ monthly in demand charges beyond energy costs.
Author: Kevin Thornton;
Source: shafer-motorsports.com
According to John Voelcker, automotive journalist and EV analyst: "The biggest disconnect I see between EV cost calculators and reality is the assumption of ideal charging behavior. Real people charge when convenient, not when optimal. A calculator showing $30 monthly costs assumes perfect discipline that most drivers won't maintain consistently."
Frequently Asked Questions
Making EV Charging Cost Calculators Work for You
Understanding calculator logic transforms these tools from mysterious number generators into genuinely useful planning instruments. The math itself stays straightforward—efficiency times rate equals cost—but real accuracy requires accounting for efficiency losses, rate structures, charging locations, and honest behavior patterns.
The most common error isn't mathematical but behavioral: assuming you'll maintain perfect charging discipline. Build estimates assuming 70-80% off-peak compliance, occasional public charging, and seasonal efficiency variations. This realistic approach produces estimates matching actual costs within 10-15%, not the 30-40% gaps overly optimistic calculators create.
Your specific situation matters infinitely more than national averages. A California driver paying $0.35/kWh peak rates faces completely different economics than a Louisiana driver at $0.09/kWh flat rates. Run calculations with your actual utility rates, your specific vehicle's EPA efficiency, and honest estimates of your charging patterns.
The encouraging news? Even with realistic assumptions accounting for all efficiency losses and occasional convenience charging, EVs typically cost 50-70% less per mile than comparable gasoline vehicles. Understanding calculator logic helps you maximize that advantage rather than discovering unexpected costs after purchase.
Related Stories

Read more

Read more


The content on Auto Insights is provided for general informational and educational purposes only. It is intended to offer guidance on car buying, vehicle ownership, finance, insurance, EVs, maintenance, accessories, reviews, and related topics, and should not be considered professional financial, legal, insurance, mechanical, or investment advice.
All information, tools, calculators, comparisons, and recommendations presented on this website are for general guidance only. Individual financial situations, driving habits, vehicle conditions, insurance policies, and market factors vary, and actual results or costs may differ from estimates provided.
Auto Insights makes no guarantees regarding accuracy, completeness, or current applicability of the information, as automotive markets, regulations, incentives, interest rates, and vehicle specifications may change over time.