
Car key, calculator, US dollar bills, toy car, and fuel nozzle on white desk representing cost per mile driving calculation
How to Calculate Cost Per Mile Driving: The Complete Formula for US Vehicle Owners

Most Americans know what they pay at the pump, but few understand the real price of every mile they drive. A $35,000 sedan doesn't just cost $35,000—it quietly drains your wallet through depreciation, insurance premiums, oil changes, and dozens of other expenses that add up to thousands of dollars annually.
Understanding your actual cost per mile driving transforms how you think about vehicle ownership. It reveals whether that 45-minute commute is worth the expense, helps you claim accurate tax deductions, and shows you exactly where your money goes each time you turn the ignition.
What Makes Up Your True Cost Per Mile Driving
Your vehicle's real expense breaks down into five major categories: fuel, maintenance and repairs, depreciation, insurance and registration, and financing costs. Each category behaves differently, but together they paint a complete picture of what you're actually spending.
Most drivers dramatically underestimate their actual costs because they focus exclusively on gas prices. A driver who spends $150 monthly on fuel might assume that's their primary vehicle expense, when in reality they're spending $600-800 per month when all costs are included. The psychological trap is simple: you feel the pain of filling up at the pump, but depreciation happens silently in the background.
The distinction between fixed and variable costs matters for decision-making. Fixed costs—insurance, registration fees, loan payments—hit your budget whether you drive 500 miles or 5,000 miles per month. Variable costs like fuel and tire wear scale directly with usage. This split explains why driving more miles actually reduces your per-mile cost for fixed expenses, since you're spreading that insurance premium across more miles. A car sitting in your driveway still costs you roughly $300-400 monthly in fixed expenses before you drive a single mile.
According to Greg Brannon, Director of Automotive Engineering at AAA, "Most Americans don't realize that depreciation and insurance often cost more per mile than the gas they're pumping. When we break down the numbers, fuel typically represents only 15-20% of total driving costs for the average vehicle."
Breaking Down Vehicle Operating Cost Per Mile by Category
Fuel Cost Per Mile Calculation Step-by-Step
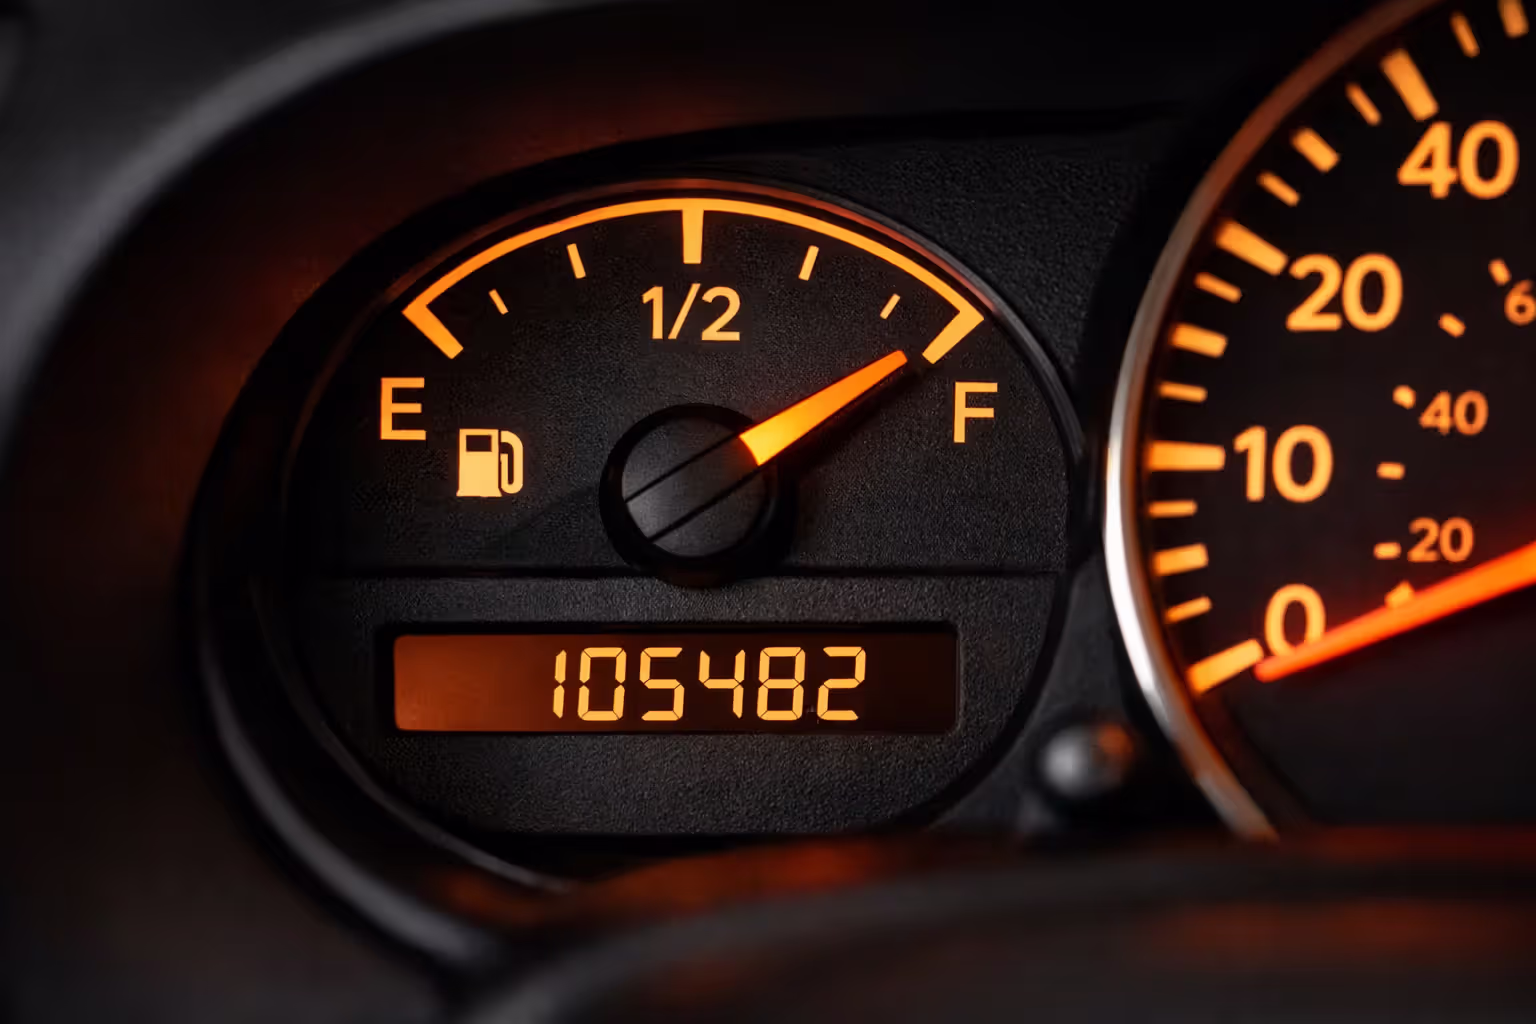
Calculate your fuel cost per mile by dividing total fuel expenses by miles driven. Track three fill-ups to establish a baseline: record the odometer reading, gallons purchased, and total cost each time. Between fill-up one and fill-up three, subtract your starting odometer reading from your ending reading to get miles driven. Add up your fuel costs for those fill-ups, then divide total cost by total miles.
For a more accurate ongoing calculation, note your vehicle's real-world MPG (not the EPA estimate). If you're getting 28 MPG and gas costs $3.50 per gallon, your fuel cost per mile is $3.50 ÷ 28 = $0.125, or 12.5 cents per mile. This number fluctuates with gas prices and driving conditions—highway driving typically costs less per mile than city driving due to better fuel efficiency.
Your actual MPG often differs from the window sticker by 10-20%. Aggressive acceleration, excessive idling, underinflated tires, and cargo weight all reduce efficiency. A driver who thinks they're getting 30 MPG might actually be getting 24 MPG, which increases their fuel cost from 11.7 cents per mile to 14.6 cents per mile at $3.50 per gallon.
Author: Derek Fulton;
Source: shafer-motorsports.com
Maintenance Cost Per Mile: What to Track
Maintenance includes oil changes, tire replacements, brake pads, filters, fluid flushes, and periodic services recommended in your owner's manual. New vehicles typically cost $0.05-0.07 per mile in maintenance during the first three years, rising to $0.10-0.15 per mile as the vehicle ages beyond 60,000 miles.
Track every service: oil changes every 5,000-7,500 miles ($50-80), tire rotations every 6,000 miles ($20-40), brake pad replacements every 40,000-70,000 miles ($200-400 per axle), and major services at 30,000, 60,000, and 90,000-mile intervals ($300-800 each). Don't forget smaller items like wiper blades ($20-40 annually), cabin air filters ($15-35), and battery replacements every 4-6 years ($100-200).
The maintenance cost per mile varies dramatically by brand. A Toyota Camry might average $0.06 per mile over 100,000 miles, while a BMW 5-Series could run $0.18 per mile for the same distance. Luxury vehicles demand premium parts, specialized service, and more frequent attention. A common mistake is budgeting only for routine maintenance while ignoring inevitable repairs—alternators, water pumps, and transmissions don't last forever.
Depreciation Per Mile and Why It's Your Biggest Expense
Depreciation represents the difference between what you paid for your vehicle and what you'll eventually sell it for. For most drivers, this is the single largest ownership cost, often exceeding fuel and maintenance combined.
New vehicles typically lose 20-30% of their value in the first year, then 10-15% annually for the next four years. A $40,000 new car might be worth $32,000 after one year, $27,000 after two years, and $23,000 after three years. If you drove 15,000 miles per year, that's $17,000 in depreciation over three years, or roughly $0.38 per mile—more than triple your fuel costs.
Calculate your actual depreciation per mile by subtracting your vehicle's current market value (check Kelley Blue Book or similar sources) from your purchase price, then dividing by total miles driven since purchase. A driver who bought a car for $35,000, has driven it 50,000 miles, and could sell it today for $22,000 has experienced $13,000 in depreciation, or $0.26 per mile.
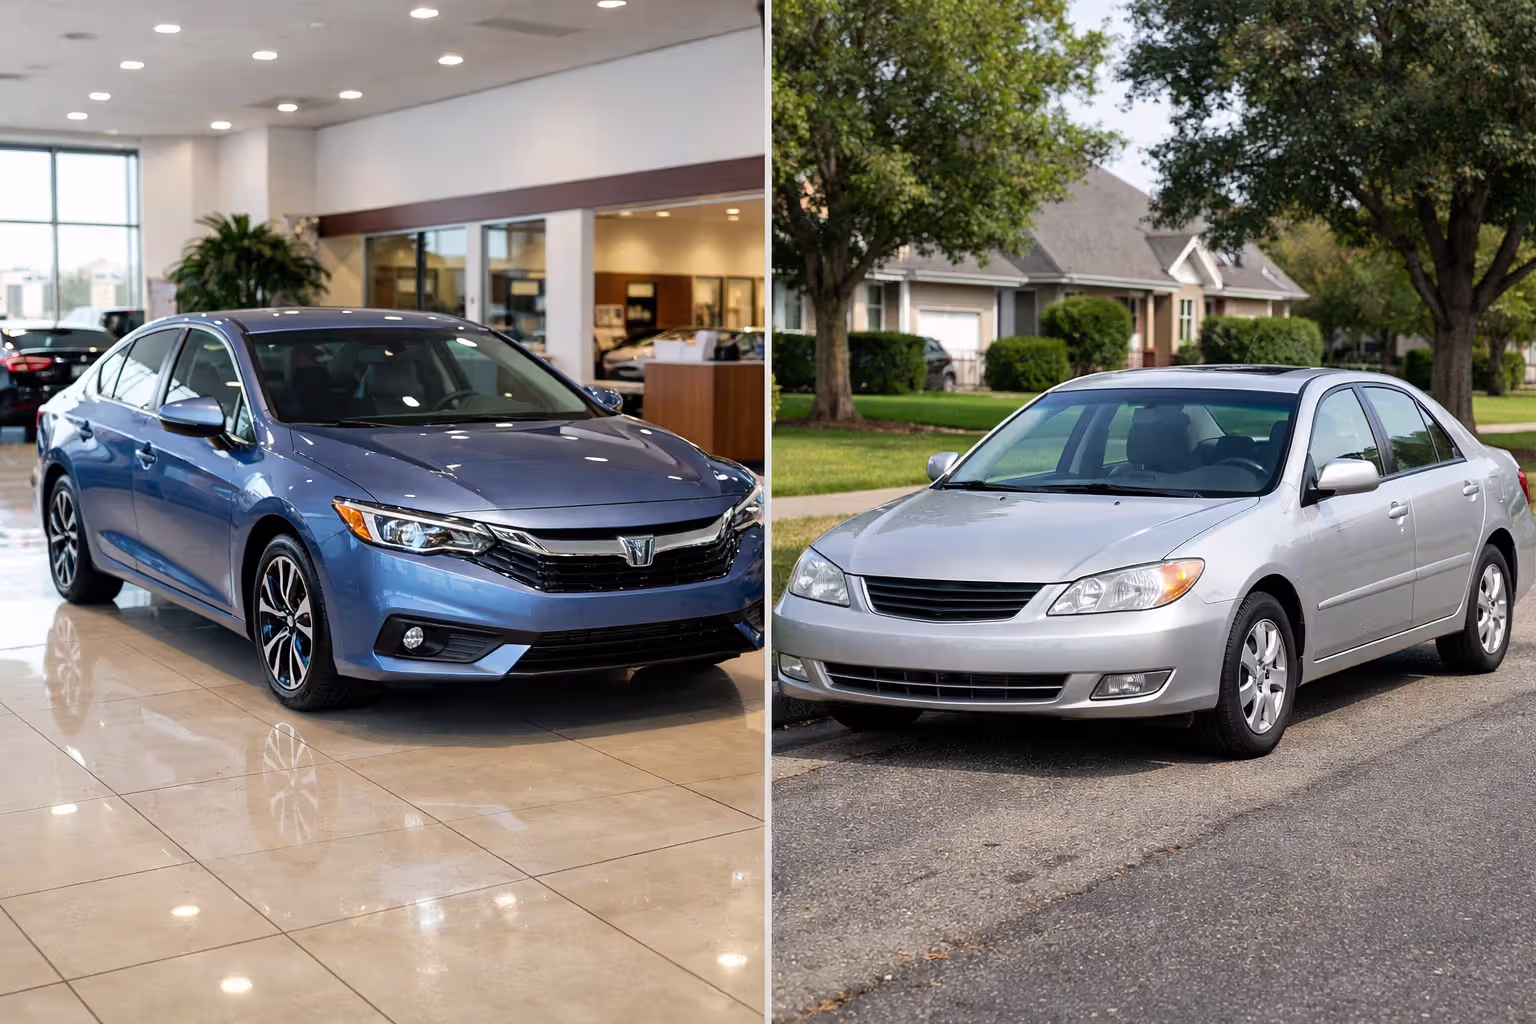
Depreciation slows over time. That same vehicle might lose only $3,000 in value over the next 50,000 miles ($0.06 per mile) as it transitions from "used" to "older used." This is why keeping vehicles longer dramatically reduces the depreciation cost per mile, even as maintenance costs rise.
The moment you drive a new car off the lot, you’ve already made the most expensive mile of your life. Every mile after that is about managing the decline
— Dave Ramsey
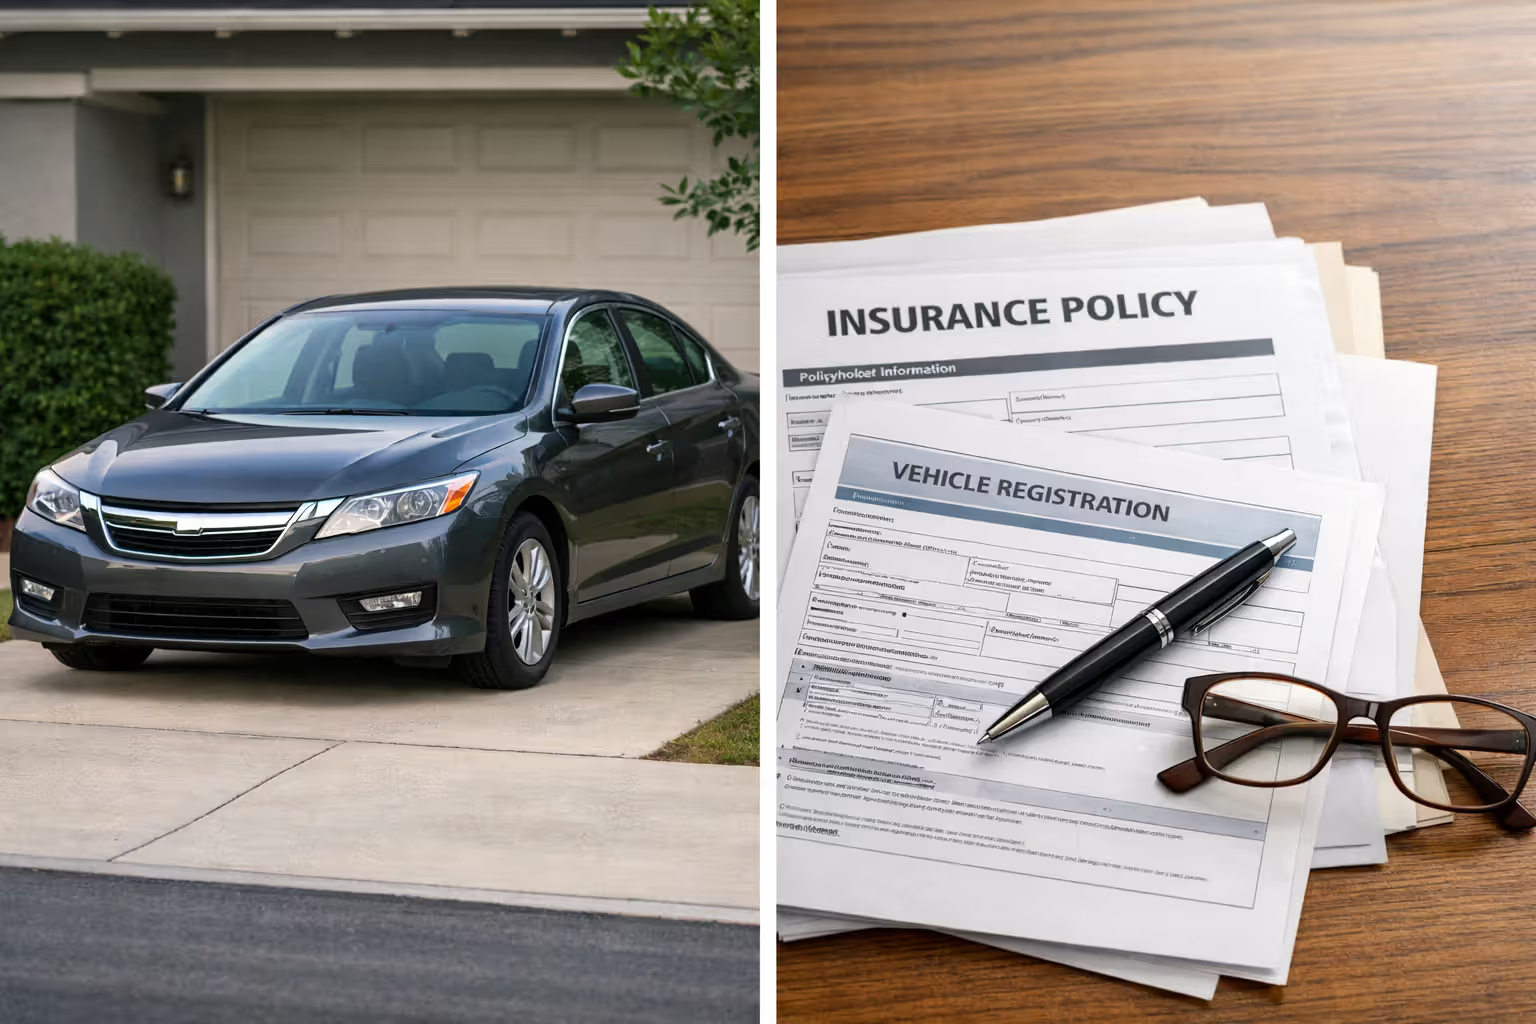
Insurance, Registration, and Fixed Ownership Costs
Insurance premiums vary wildly based on location, driving record, coverage levels, and vehicle type. The average American pays $1,500-2,000 annually for full coverage, though rates in Michigan or Florida can exceed $3,000, while drivers in Maine or Idaho might pay under $1,000.
Registration and licensing fees depend on your state. Some states charge flat fees ($50-150 annually), while others calculate fees based on vehicle value, weight, or age. Add personal property taxes if your state assesses them—these can run several hundred dollars annually for newer vehicles.
Convert these fixed costs to per-mile figures by dividing by your annual mileage. A driver paying $1,800 for insurance and $200 for registration who drives 15,000 miles annually pays $0.133 per mile for these fixed costs. Drive only 10,000 miles, and that jumps to $0.20 per mile. Drive 20,000 miles, and it drops to $0.10 per mile. This math explains why high-mileage drivers often have lower per-mile costs overall.
Author: Derek Fulton;
Source: shafer-motorsports.com
Financing Costs and Interest
If you financed your vehicle, interest represents a real cost that many drivers forget to include. A $30,000 loan at 6% APR over 60 months costs roughly $3,200 in interest over the life of the loan. Spread across 75,000 miles (15,000 per year for five years), that's $0.043 per mile just for interest.
Cash buyers avoid interest but face opportunity cost—money tied up in a depreciating asset can't be invested elsewhere. A driver who pays $30,000 cash instead of investing that money at a 7% annual return gives up roughly $2,100 in investment gains in the first year alone.
The Simple Formula to Calculate Your Personal Driving Costs
Step 1: Track annual expenses by category. Create a spreadsheet with columns for fuel, maintenance, insurance, registration, loan payments, and any other vehicle-related expenses. For one year, record every expense. Include parking fees if they're regular, but exclude tolls unless they're a fixed part of your commute.
Step 2: Record total miles driven. Note your odometer reading on January 1st and December 31st (or any 12-month period). Subtract the starting reading from the ending reading. If you didn't track this last year, start now and calculate next year, or estimate based on typical weekly driving patterns.
Step 3: Apply the calculation. Divide total annual expenses by total annual miles. The result is your cost per mile driving.
Real example: Sarah drives a 2021 Honda CR-V. Over 12 months, she tracked these expenses:
- Fuel: $1,920 (160 gallons × $12 average per fill-up)
- Maintenance: $480 (three oil changes, one tire rotation, one brake inspection)
- Insurance: $1,440 ($120 monthly)
- Registration: $185
- Loan payment: $4,800 ($400 monthly), of which approximately $720 was interest
- Depreciation: $3,500 (estimated value drop from $28,000 to $24,500)
Total annual cost: $12,325
Miles driven: 14,200
Cost per mile: $12,325 ÷ 14,200 = $0.868, or 86.8 cents per mile
Sarah was shocked—she'd assumed her main cost was the $160 monthly in gas, when in reality she was spending over $1,000 monthly on her vehicle.

Author: Derek Fulton;
Source: shafer-motorsports.com
Free tracking tools include apps like MileIQ, Everlance, and Drivvo, which automatically log trips using your phone's GPS. Mint and YNAB (You Need A Budget) help categorize vehicle expenses. For simpler tracking, a basic spreadsheet or even a notebook in your glove compartment works fine.
Average Cost Per Mile by Vehicle Type in 2024
Vehicle costs vary significantly based on size, fuel type, and market segment. The table below shows national averages based on 15,000 miles driven annually:
| Vehicle Category | Fuel Cost | Maintenance | Depreciation | Insurance | Total Per Mile |
| Compact Sedan | $0.11 | $0.06 | $0.21 | $0.09 | $0.47 |
| Midsize Sedan | $0.13 | $0.07 | $0.28 | $0.11 | $0.59 |
| SUV | $0.16 | $0.08 | $0.35 | $0.13 | $0.72 |
| Pickup Truck | $0.19 | $0.09 | $0.38 | $0.14 | $0.80 |
| Electric Vehicle | $0.04 | $0.05 | $0.32 | $0.12 | $0.53 |
| Luxury Sedan | $0.15 | $0.14 | $0.52 | $0.17 | $0.98 |
Electric vehicles show dramatically lower fuel costs—charging typically costs 25-40% of what gasoline costs for equivalent mileage. A vehicle getting 30 MPG at $3.50 per gallon costs $0.117 per mile for fuel, while an EV getting 3.5 miles per kWh at $0.14 per kWh costs only $0.04 per mile. Maintenance costs also run lower due to no oil changes, fewer brake replacements (regenerative braking), and simpler drivetrains.
However, EVs currently face higher depreciation due to rapidly improving technology, battery degradation concerns, and federal tax credits that reduce used vehicle values. A $50,000 EV might depreciate $15,000 in three years, while a comparable $40,000 gas vehicle might depreciate $12,000.
Pickup trucks and SUVs dominate American roads but carry the highest per-mile costs. Their popularity creates a financial paradox—drivers choose them for occasional utility (towing a boat twice per year, hauling lumber once per month) while paying premium costs for daily commuting.
7 Factors That Increase Your Cost Per Mile (And How to Lower Them)
Driving habits and aggressive acceleration: Jackrabbit starts and hard braking reduce fuel economy by 15-30% in city driving. Smooth acceleration and anticipating stops saves fuel and reduces brake wear. The driver who floors it from every stoplight might spend $0.15 per mile on fuel while their calm neighbor spends $0.11 per mile in an identical vehicle.
Vehicle age and mileage: Maintenance costs climb steeply after 75,000 miles as major components reach end-of-life. A 12-year-old vehicle might need $2,000 in repairs annually, adding $0.13 per mile if you drive 15,000 miles. However, depreciation simultaneously drops to near-zero, often making older vehicles cheaper per mile overall despite higher maintenance.
Author: Derek Fulton;
Source: shafer-motorsports.com
Author: Derek Fulton;
Source: shafer-motorsports.com
Geographic location and gas prices: California drivers paying $5.00 per gallon spend nearly double the fuel cost per mile compared to drivers in Texas or Louisiana paying $2.80 per gallon. Location also affects insurance—urban drivers face higher premiums due to accident frequency and theft rates.
Maintenance schedule adherence: Skipping oil changes to save $60 can lead to $4,000 engine repairs. Following manufacturer recommendations prevents expensive failures. Drivers who extend oil changes from 5,000 to 10,000 miles without synthetic oil risk accelerated engine wear, potentially costing $0.10+ per mile in premature replacement needs.
Tire and parts quality choices: Premium tires cost more upfront but last longer and improve fuel economy. A $600 set of quality tires lasting 60,000 miles costs $0.01 per mile, while $400 budget tires lasting 40,000 miles also cost $0.01 per mile—but the premium tires likely saved $0.005 per mile in fuel efficiency, making them cheaper overall.
Commute distance patterns: Short trips (under 3 miles) are the most expensive per mile. Your engine never reaches optimal operating temperature, fuel economy suffers, and you spread fixed costs across fewer miles. A 2-mile commute might cost $1.50 per mile when you account for depreciation and insurance, while a 20-mile commute might cost $0.60 per mile.
Vehicle selection mistakes: Buying more vehicle than you need inflates every cost category. The driver who purchases a $55,000 luxury SUV for a 10-mile commute might spend $1.20 per mile, while a $25,000 sedan driver spends $0.50 per mile for the same trip. Over five years and 75,000 miles, that's a $52,500 difference.
Beware of little expenses. A small leak will sink a great ship
— Benjamin Franklin
When to Use Cost Per Mile for Financial Decisions
Comparing ownership vs. leasing: Calculate your owned vehicle's cost per mile, then compare it to lease payments divided by miles driven. Leases typically cost $0.60-0.90 per mile when you include the monthly payment, insurance, and maintenance. If your owned vehicle costs less, ownership wins. If you're paying $0.95 per mile for an aging vehicle with mounting repairs, leasing might be cheaper.
Evaluating work commute expenses: Multiply your cost per mile by your daily commute distance and work days per year. A 30-mile round-trip commute at $0.70 per mile costs $21 daily or $5,250 annually (250 work days). This number helps evaluate job offers—a position paying $5,000 more but requiring a longer commute might actually cost you money.

Author: Derek Fulton;
Source: shafer-motorsports.com
Tax deductions for business mileage: The IRS allows business mileage deductions at a standard rate ($0.655 per mile for 2023). If your actual cost per mile is $0.55, you're gaining $0.105 per mile in tax benefits. If your actual cost is $0.75 per mile, you're losing money on business driving even with the deduction. Self-employed individuals should track actual expenses if they exceed the standard rate.
Deciding when to sell or trade-in: When annual maintenance costs push your per-mile cost above $0.80-1.00, consider replacement. A vehicle costing $0.95 per mile due to frequent repairs might be worth selling, even if you face higher depreciation on a newer vehicle. Run the numbers for your specific situation—sometimes keeping an older vehicle with high maintenance costs still beats taking on a new loan.
Comparing rideshare costs to ownership: Uber or Lyft typically costs $1.50-3.00 per mile depending on your market. If your vehicle costs $0.65 per mile and you drive 12,000 miles annually, ownership costs $7,800. The same mileage via rideshare at $2.00 per mile costs $24,000. However, if you only drive 3,000 miles annually, rideshare at $6,000 beats ownership at $7,800 (fixed costs don't scale down proportionally).
Frequently Asked Questions About Driving Expense Analysis
Making Every Mile Count
Knowing your true cost per mile driving transforms abstract vehicle expenses into concrete numbers you can act on. That number—whether it's $0.52 or $1.15—represents the real price you pay for mobility, and understanding it helps you make smarter decisions about where you live, what you drive, and how you travel.
The calculation isn't complicated: track your expenses for a year, record your mileage, and divide. What you discover might surprise you. Most drivers find their actual costs run 40-60% higher than they estimated, with depreciation and insurance consuming more money than fuel.
Use your cost per mile as a decision-making tool. Compare it against alternatives when evaluating a job opportunity with a longer commute. Reference it when deciding whether to repair or replace an aging vehicle. Apply it when calculating business mileage or considering whether to drive or fly for a trip.
The drivers who understand their numbers are the ones who make informed choices rather than emotional ones. They know whether that truck really makes financial sense, whether their commute is actually costing them money, and when it's time to let go of a vehicle that's become too expensive to maintain. Your cost per mile is more than just a number—it's your roadmap to smarter vehicle ownership.
Related Stories
Read more
Read more


The content on Auto Insights is provided for general informational and educational purposes only. It is intended to offer guidance on car buying, vehicle ownership, finance, insurance, EVs, maintenance, accessories, reviews, and related topics, and should not be considered professional financial, legal, insurance, mechanical, or investment advice.
All information, tools, calculators, comparisons, and recommendations presented on this website are for general guidance only. Individual financial situations, driving habits, vehicle conditions, insurance policies, and market factors vary, and actual results or costs may differ from estimates provided.
Auto Insights makes no guarantees regarding accuracy, completeness, or current applicability of the information, as automotive markets, regulations, incentives, interest rates, and vehicle specifications may change over time.