
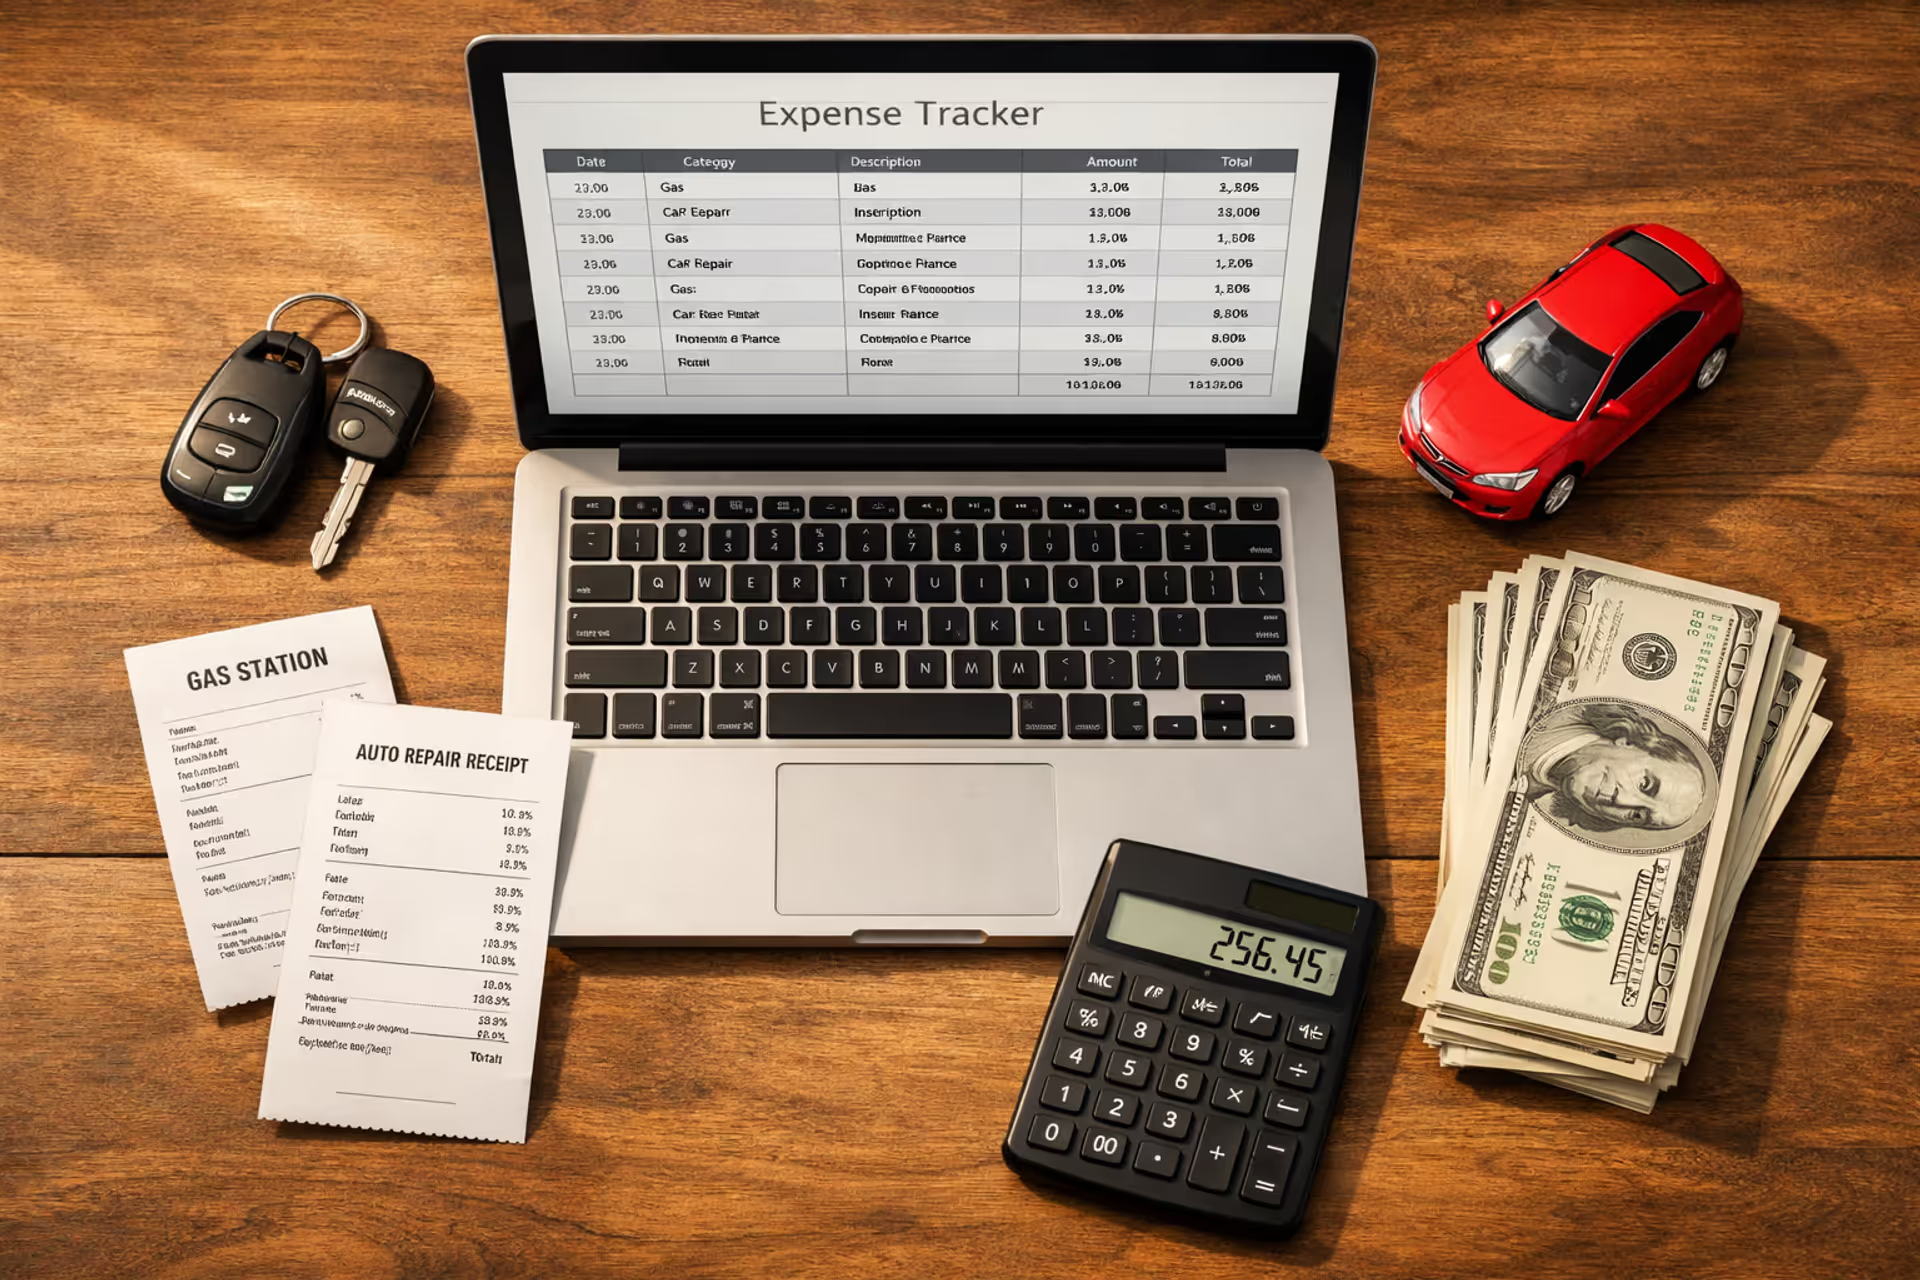
Flat lay desk with laptop showing car expense spreadsheet, car keys, gas station receipts, calculator, dollar bills, and miniature car model
How to Start Tracking Car Expenses: A Complete System for Vehicle Owners

You know what your car payment is. Maybe you have a ballpark figure for gas. But ask yourself: what did vehicle ownership actually cost you last year? If you're drawing a blank—or worse, wildly guessing—you're bleeding money without realizing it.
Between $9,000 and $12,000 leaves the average American's bank account annually for vehicle-related expenses. That's rent-level spending on something most people track less carefully than their Netflix subscription.
Why Most Drivers Underestimate Their True Vehicle Costs
Here's how the math blindsides you.
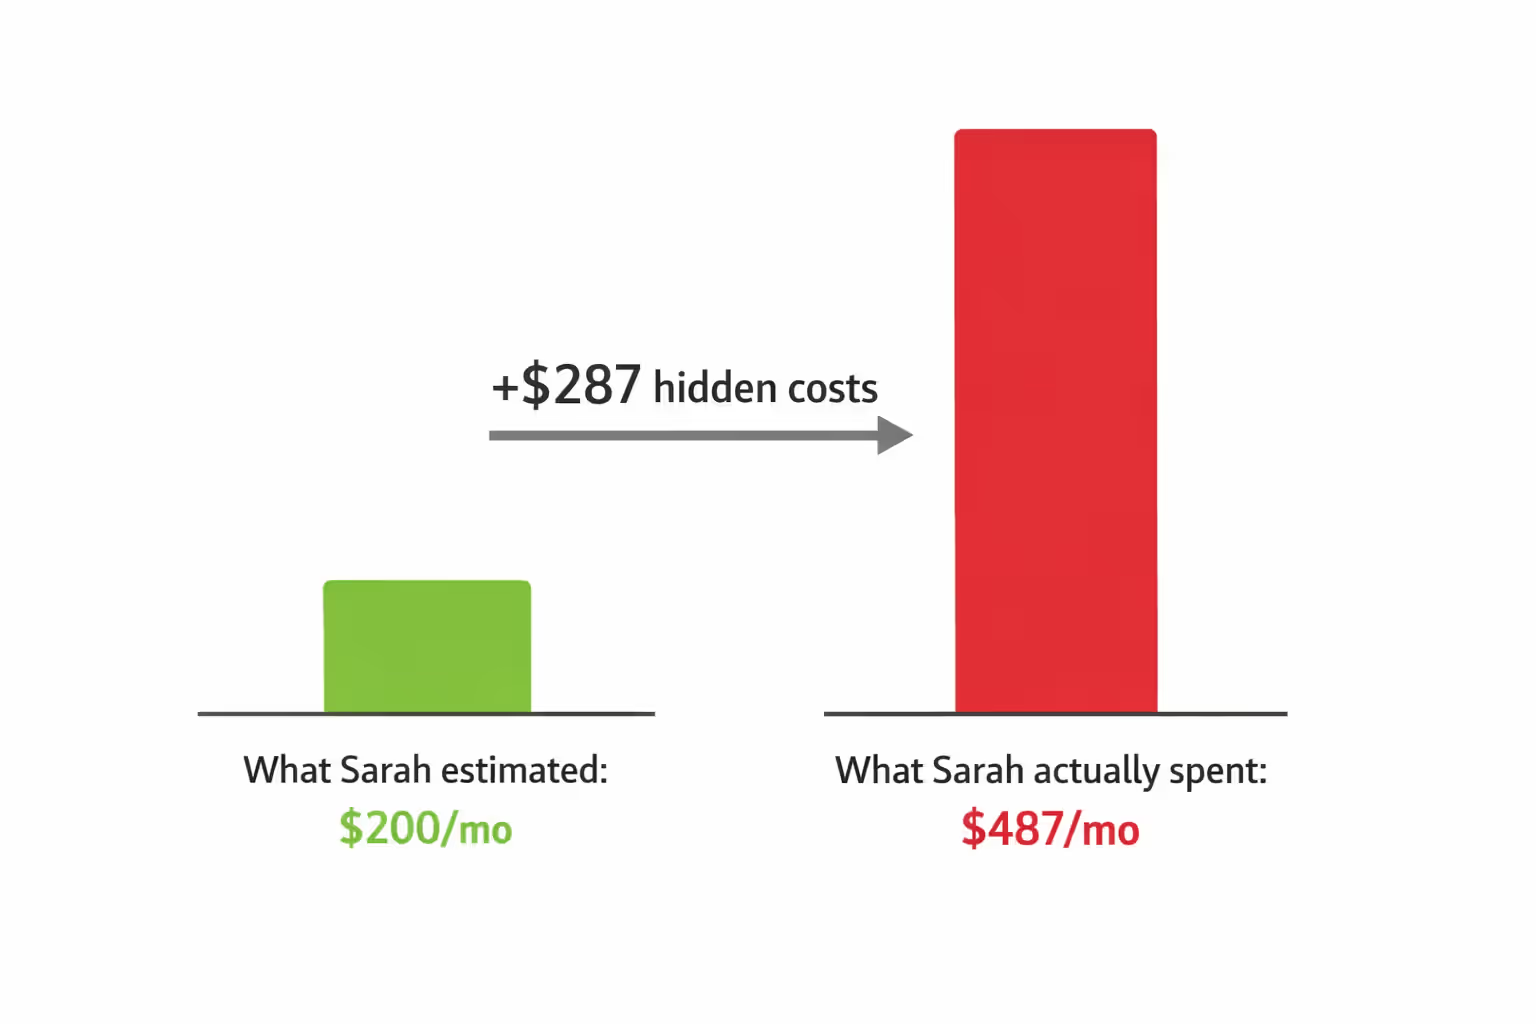
Sarah drives a 2018 Honda Civic. Decent on gas, reliable reputation, paid-off loan. She figured ownership ran about $200 monthly—mostly fuel for her commute. Made sense in her head: gas twice weekly at $35 per fill-up, call it $150. Toss in $50 for the occasional oil change. Done.
Six months of actual tracking? $487 per month on average.
Author: Lena Prescott;
Source: shafer-motorsports.com
Where'd the other $287 hide? Semi-annual insurance payments she'd mentally filed under "occasional expenses." The $680 registration renewal that caught her off-guard in March. Two new front tires after hitting a pothole. Brake pads. That $89 diagnostic when the check engine light came on (false alarm, loose gas cap). Parking meters downtown. The car wash subscription she forgot she'd started.
This pattern plays out in household after household. Vehicle expenses don't arrive on predictable schedules like your cell phone bill. Insurance hits twice yearly or monthly depending on your payment plan. Tires wear out gradually, then suddenly you need four at once. The transmission fluid change sneaks up every 50,000 miles. Your brain defaults to tracking recurring monthly charges while one-time and irregular expenses evaporate from memory.
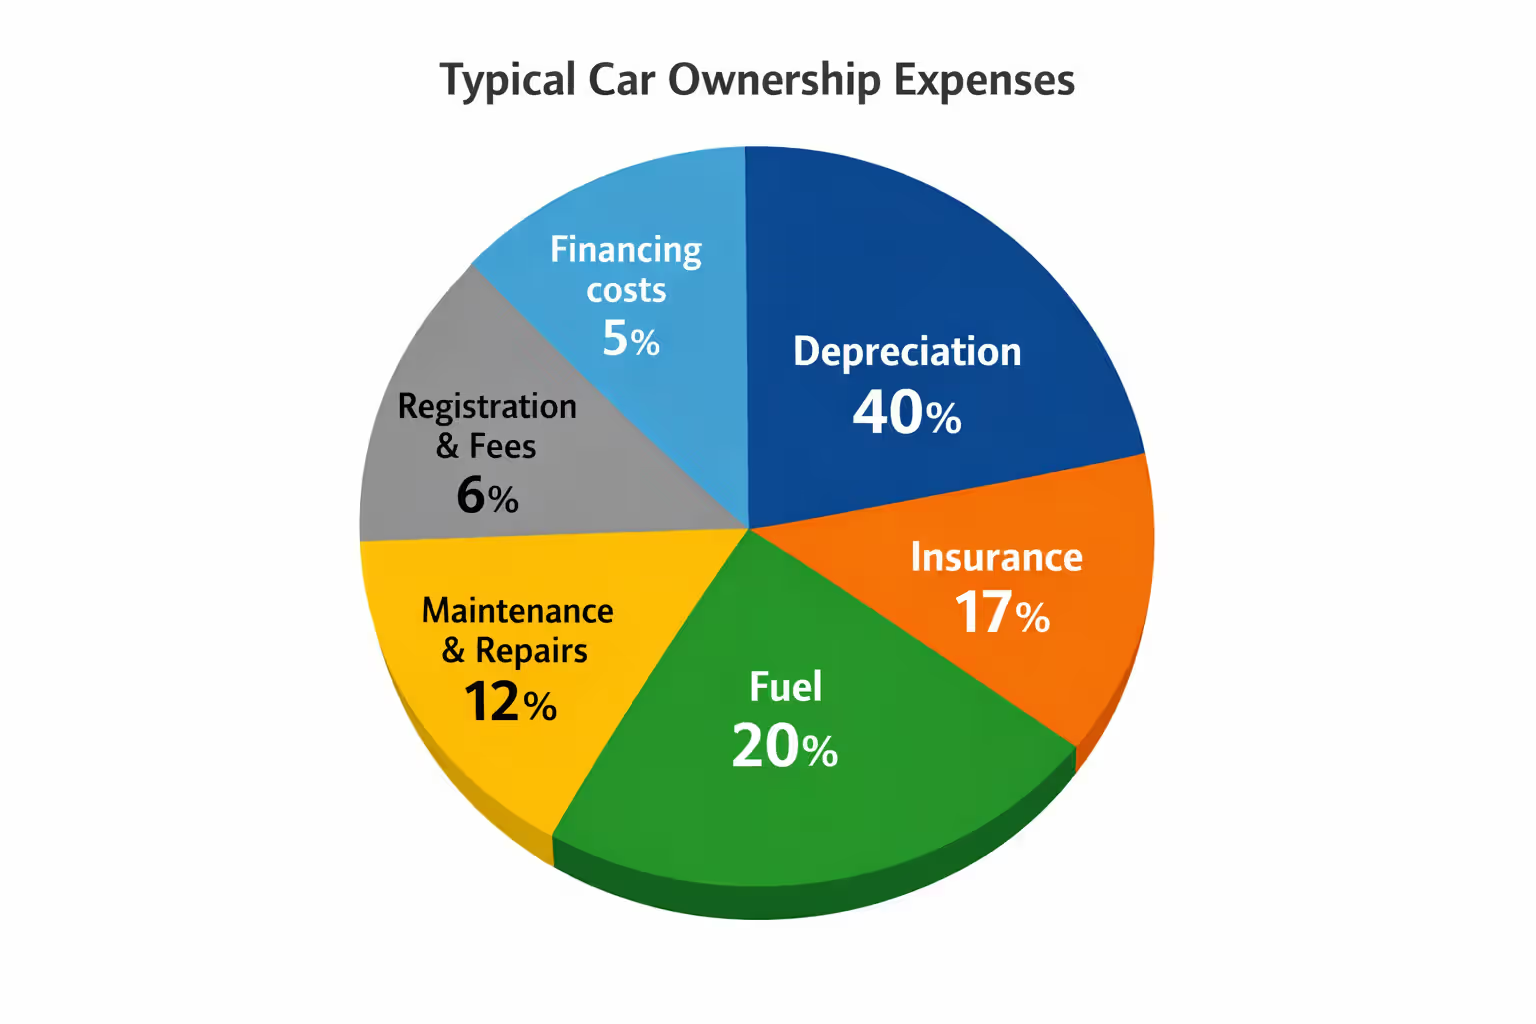
Here's the part that really stings: depreciation—your biggest single expense—operates invisibly. A $30,000 vehicle shedding $4,000 in value each year costs you $333 monthly before you've driven anywhere. Pile on insurance, registration, and loan interest, and you're $500 deep in fixed costs before touching the gas pump.
Vehicle cost analysis isn't about guilt or penny-pinching. It's about ending the guesswork. Transportation claims 16% of the typical American household budget—second only to housing. Without solid numbers, you're flying blind on major financial decisions. Should you repair that transmission or trade in? Refinance the loan? Move closer to work? Keep driving your beater another year? You can't answer any of these questions with confidence using gut feelings and fuzzy estimates.
Author: Lena Prescott;
Source: shafer-motorsports.com
What to Track: Breaking Down Your Vehicle's Cost Categories
Fixed vs. Variable Expenses
Some expenses hit whether you drive two miles or two thousand.
Fixed ownership costs: - Monthly loan or lease payments - Insurance coverage (liability, collision, comprehensive) - Annual registration and title fees - Property taxes on vehicles (Texas, Virginia, and other states assess these) - Reserved parking spots at your apartment or workplace
Variable costs scale up and down with usage: - Gasoline or diesel fuel - Routine maintenance (oil, filters, fluids) - Repairs from wear and tear - Tire replacements - Car washes and detailing - Tolls, parking meters, garage fees
Depreciation straddles both categories. Time alone degrades vehicle value—a garage-kept car with 5,000 annual miles still loses worth. But mileage accelerates the decline. Put 25,000 miles yearly on your odometer and you'll crater resale value faster than someone driving 10,000.
Hidden Costs That Drain Your Budget
The obvious expenses—fuel, insurance, payments—everyone knows about. These quiet budget killers slip past most people:
Opportunity cost on your down payment: That $6,000 you put down could be earning 4.5% in a high-yield savings account. Over a five-year loan term, you've sacrificed roughly $1,350 in potential interest income. Not devastating, but real money nonetheless.
Premium fuel requirements: Many newer vehicles demand 91+ octane. You're paying $0.40-$0.70 more per gallon than regular. Drive 15,000 miles yearly in a car averaging 27 MPG? That premium requirement costs you an extra $222-$389 annually just in fuel grade.
Parking violations: Americans collectively pay $7 billion in parking tickets each year. Even one $45 ticket quarterly adds $180 to your true annual cost.
Accessories and add-ons: Weathertech floor mats, phone mounts, bike racks, remote starters, upgraded speakers—these aren't maintenance, but they're money leaving your account for vehicle-related purposes. That counts.
Interest on financed repairs: Major repair catches you without emergency savings? Charging that $1,400 brake job to a credit card at 19% APR and taking eight months to pay it off tacks on another $106 in interest charges.
Comprehensive ownership financial planning captures these outliers. Miss them and your monthly vehicle budget calculations can be understated by $75-$200.
Beware of little expenses; a small leak will sink a great ship
— Benjamin Franklin
Choosing the Right Method for Your Tracking Style
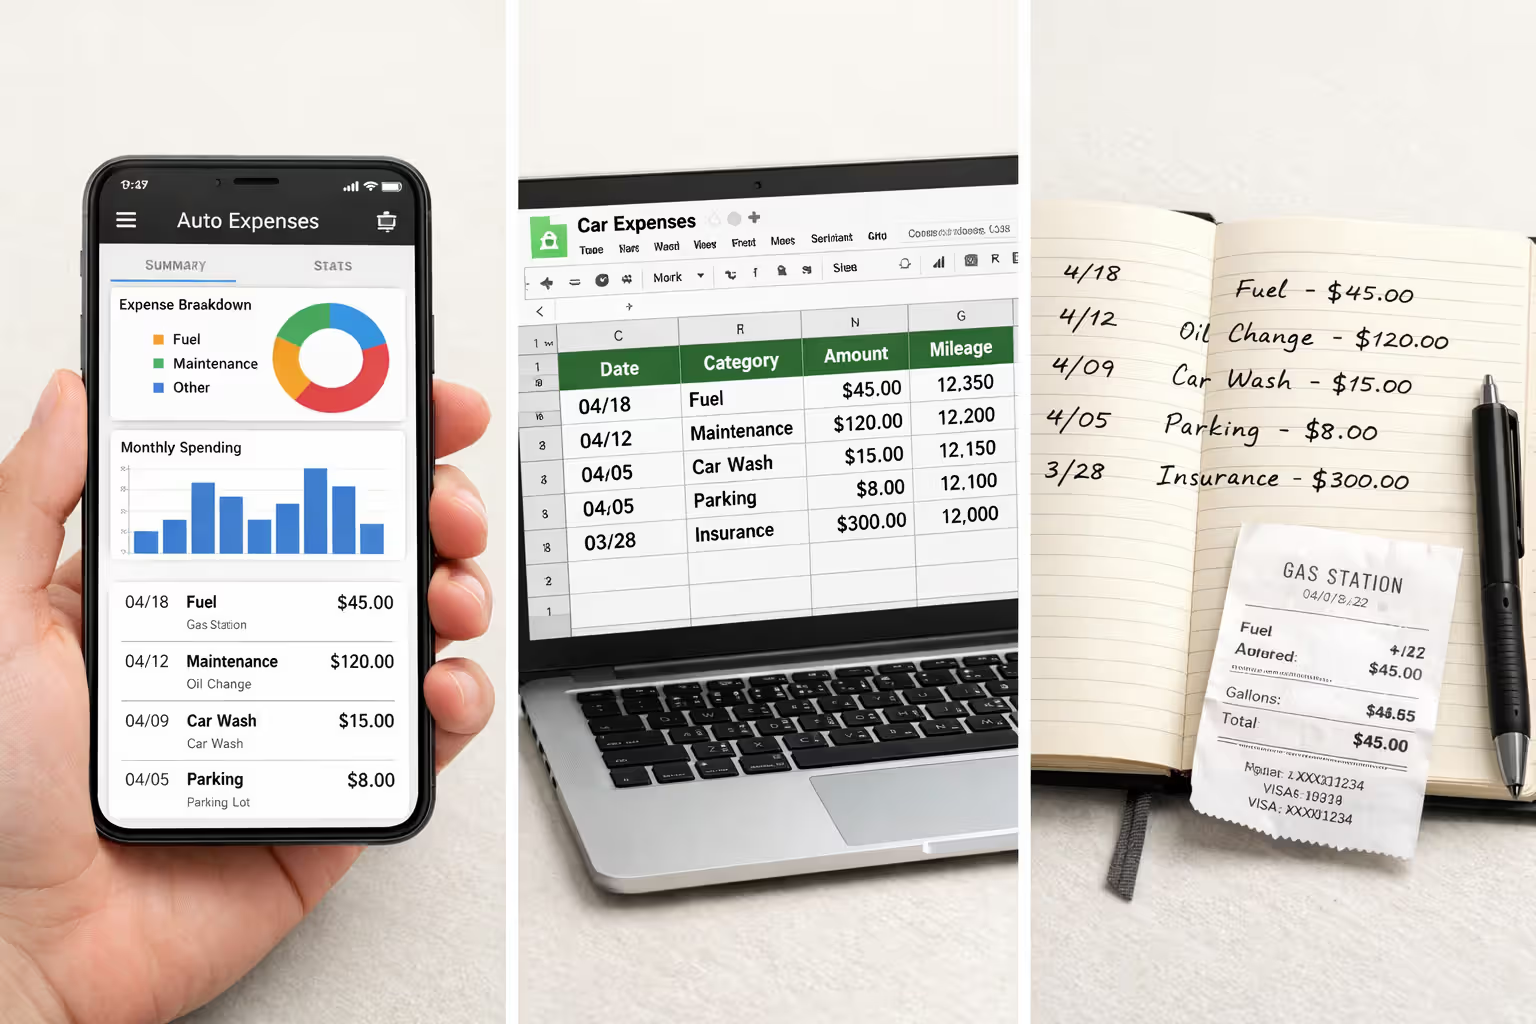
Manual Spreadsheet Systems
Build your own template in Google Sheets or Excel. Set up columns for date, category, amount, odometer reading, and notes. Create a second tab for annual summaries and per-mile cost calculations.
Who this fits: Anyone comfortable with basic formulas who values complete customization. Perfect for tracking multiple vehicles or integrating car data into broader household budgets.
Time commitment: Initial setup takes 2-3 hours. Weekly logging runs 5-10 minutes once you're in a groove.
What you'll miss: Automation. No receipt scanning, no GPS mileage capture, no reminder notifications. Pure manual discipline required.
Mobile Apps and Digital Solutions
Dedicated automotive tracking apps—Drivvo, MileIQ, Fuelly, CarCost—handle the heavy lifting. Snap photos of receipts, let GPS log mileage automatically, get maintenance reminders pushed to your phone. Most generate visual spending reports and identify cost trends.
Who this fits: Smartphone-dependent folks who want minimal manual work. Especially valuable if you need mileage tracking for tax deductions or employer reimbursement.
What it costs: Free versions typically cap entries or lock premium features. Full access runs $3-$10 monthly or $30-$80 for annual subscriptions.
The tradeoff: Less flexibility than building your own system. Switching apps down the road means manually migrating your historical data.
Hybrid Approaches
Author: Lena Prescott;
Source: shafer-motorsports.com
Snap receipt photos and dump them in a cloud folder. Once monthly, batch-enter the summarized data into a simple spreadsheet. Or use YNAB or Mint to automatically capture credit card transactions, then export car-related charges quarterly for deeper automotive-specific analysis.
Who this fits: People wanting automated transaction capture from their bank feeds but needing specialized vehicle calculations that general budget apps don't provide.
The workflow: Tag car purchases in your budgeting app as they happen. Export the tagged transactions monthly. Import into a specialized spreadsheet or automotive app for mileage-based number crunching.
Here's how popular tracking approaches stack up:
| Tracking Approach | Ideal User | Price Range | Difficulty Level | Can You Export Data? | Strengths | Weaknesses |
| Build-your-own spreadsheet | People comfortable with formulas who want total control | Free | Medium difficulty—requires spreadsheet skills | Complete control over exports | Customize everything, use offline, no ongoing costs | Manual data entry for every transaction, zero automation |
| Specialized automotive apps like Drivvo or MileIQ | Smartphone users prioritizing convenience | Free to $80 yearly | Easy to start | Usually CSV exports available | Scan receipts with camera, GPS auto-logging, maintenance alerts | Subscription fees add up, limited customization options |
| General budget apps (Mint, YNAB) with car categories | Current users of these platforms | Free to $99 annually | Easy to moderate | Solid export capabilities | Banks sync automatically, see cars within total financial picture | Missing vehicle-specific features like MPG tracking |
| Old-school paper logbook | Tech skeptics or classic car owners | $5-$15 one-time | Extremely simple | You'll manually transcribe later | Dead simple, no technology needed, very cheap upfront | Tedious to maintain, easily lost or damaged, no automatic calculations |
Pick whatever ownership budgeting method you'll actually stick with. A basic system used religiously beats a sophisticated setup you abandon after six weeks.
Setting Up Your Fuel and Maintenance Tracking System
Begin with fuel because you'll interact with this expense most frequently. Every fill-up, capture these data points:
- Current date
- Odometer reading at fill-up
- Gallons pumped
- Price per gallon
- Total purchase amount
- Station location (optional—useful for spotting geographic price patterns)
Why bother with all this detail? Fuel tracking systems built on complete data unlock crucial insights. Take your current odometer reading minus the previous one. Divide those miles by gallons purchased. You've just calculated your actual MPG for that tank.
Notice your fuel economy dropping from 29 MPG to 23 MPG over three consecutive tanks? Something's wrong. Could be underinflated tires, a failing oxygen sensor, dirty air filter, or aggressive driving habits torching fuel. Either way, the data tipped you off before a minor problem became expensive.
Many drivers use apps that detect gas station visits via GPS and prompt you to log the fill-up. Reduces forgotten entries, though you'll need location services running.
For maintenance expense tracking, organize around your vehicle's service schedule:
Routine scheduled maintenance (predictable based on mileage): - Oil and filter changes—every 5,000-7,500 miles for conventional oil, 10,000+ for full synthetic - Tire rotations—every 6,000-8,000 miles - Air filter replacements—every 15,000-30,000 miles depending on conditions - Transmission fluid service—every 30,000-60,000 miles per manufacturer specs
Wear items (you know they're coming, just not exactly when): - Brake pads and rotors - Tire replacements - Battery - Wiper blades - Serpentine belts
Unexpected repairs (stuff breaks when it breaks): - Alternator failures - Sensor replacements - Suspension components - Exhaust system repairs - Water pump, thermostat, radiator issues
Inspections and diagnostic work: - State safety inspections - Emissions testing - Check engine light diagnostics
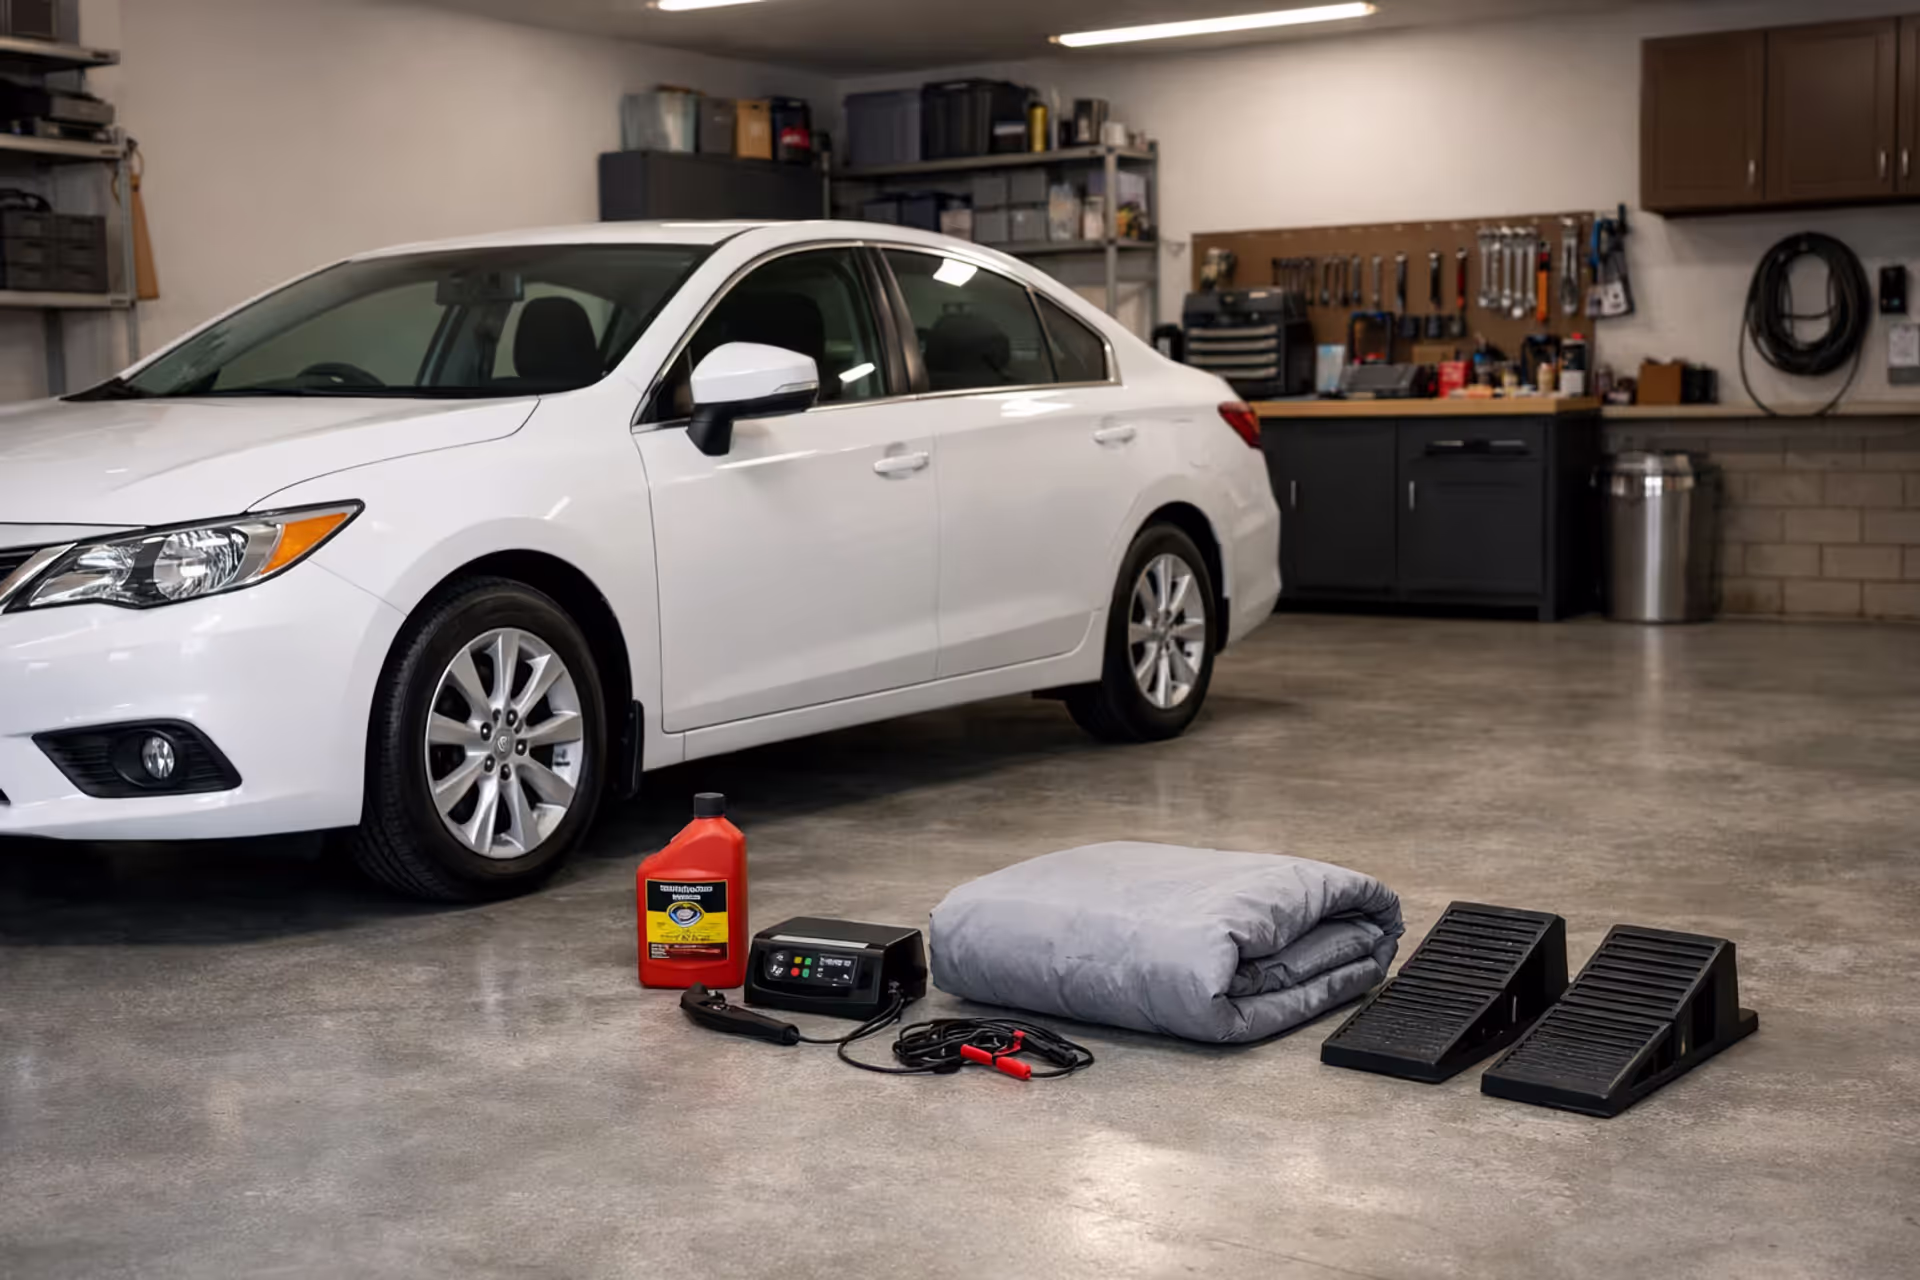
Log the date, current mileage, what got replaced or repaired, parts cost, labor charges, and which shop did the work. This historical record serves multiple purposes. You'll spot patterns—like discovering one shop consistently charges 25% above competitors for identical work. When selling, documented maintenance history can boost resale value by $500-$1,500 because buyers trust a well-maintained vehicle.
Set yourself calendar reminders for predictable services. Change oil every 6,000 miles and drive 1,000 monthly? Reminder goes off in six months. Expense monitoring tools with built-in service schedulers handle this automatically based on your mileage entries.
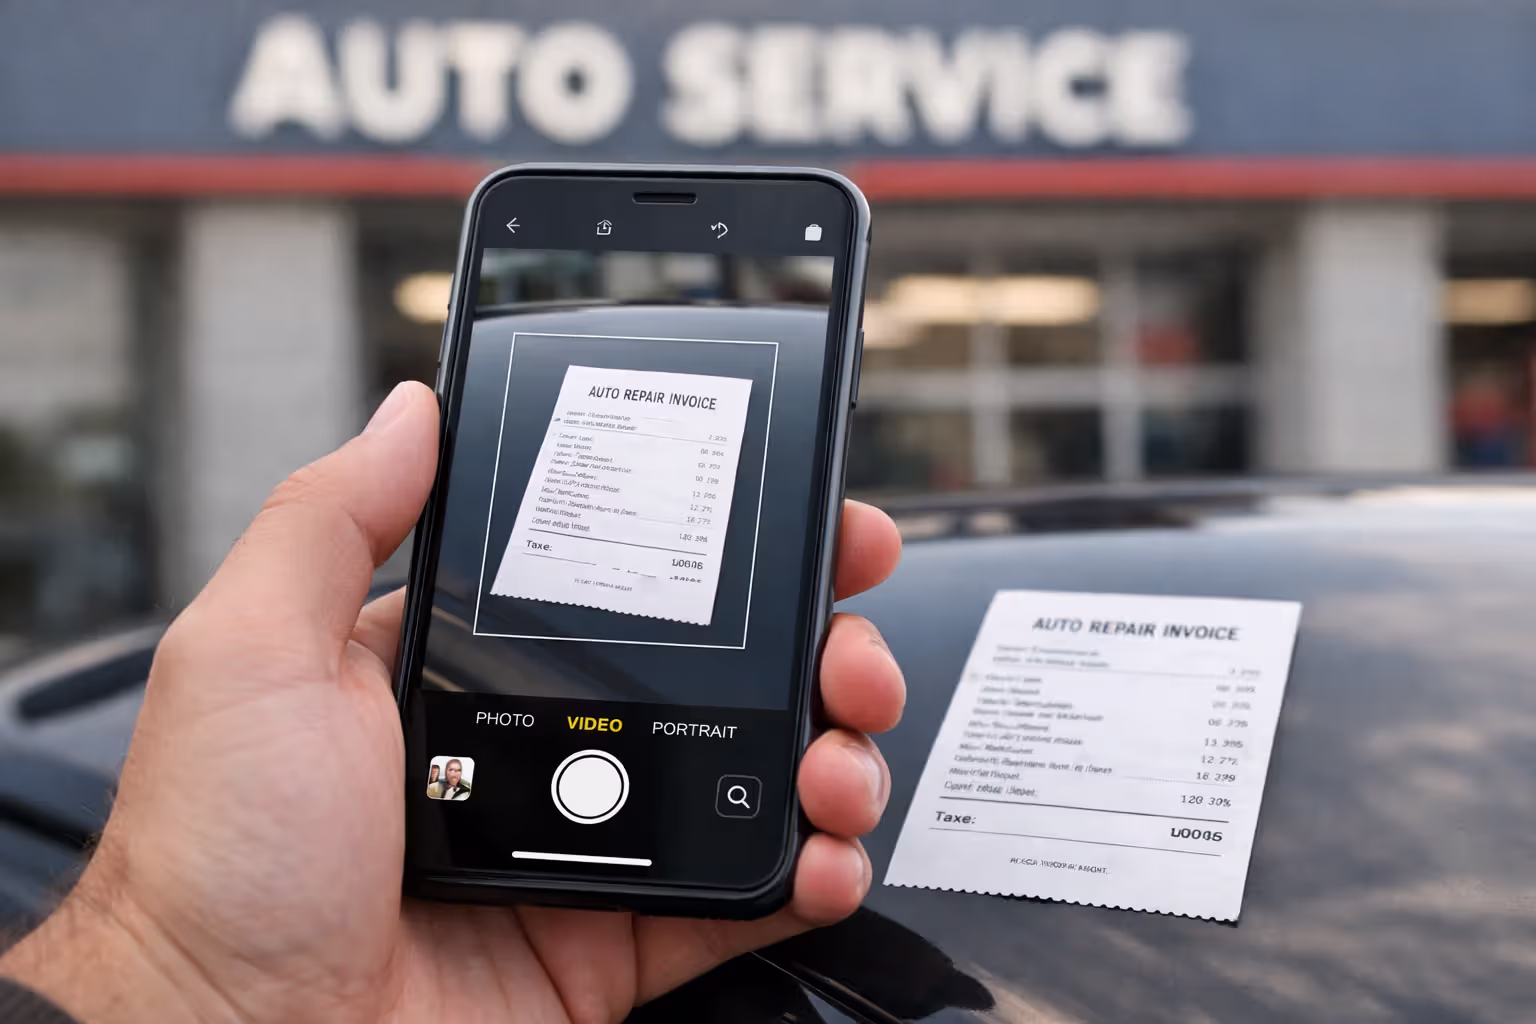
Take photos of every receipt the moment you receive it. Store in a dedicated cloud folder organized by year. Digital records satisfy most accounting requirements, and you'll avoid that shoebox full of faded thermal paper when you need proof three years later.
Author: Lena Prescott;
Source: shafer-motorsports.com
Analyzing Your Data: How to Spot Expensive Patterns
Three months of consistent tracking gives you enough data to spot trends. Six months lets you calculate meaningful averages that account for irregular expenses.
Start with your total cost per mile. Add every expense for the period—fuel, maintenance, repairs, insurance, registration, loan payments, estimated depreciation. Divide by total miles driven. A typical sedan runs $0.50-$0.70 per mile all-in. Trucks and SUVs hit $0.70-$1.00 per mile.
Break down the components:
- Fuel cost per mile: Total spent on gas ÷ miles driven
- Maintenance and repair cost per mile: All service expenses ÷ miles driven
- Fixed ownership cost per mile: (Insurance + registration + loan payments) ÷ miles driven
- Depreciation per mile: (Starting value - current value) ÷ miles driven
Running significantly above $0.15 per mile in maintenance? You're either driving an aging vehicle demanding frequent attention, or you're overpaying for service. Compare your fuel cost per mile against your vehicle's EPA estimates. Spending substantially more points to either inefficient driving habits or mechanical problems dragging down fuel economy.
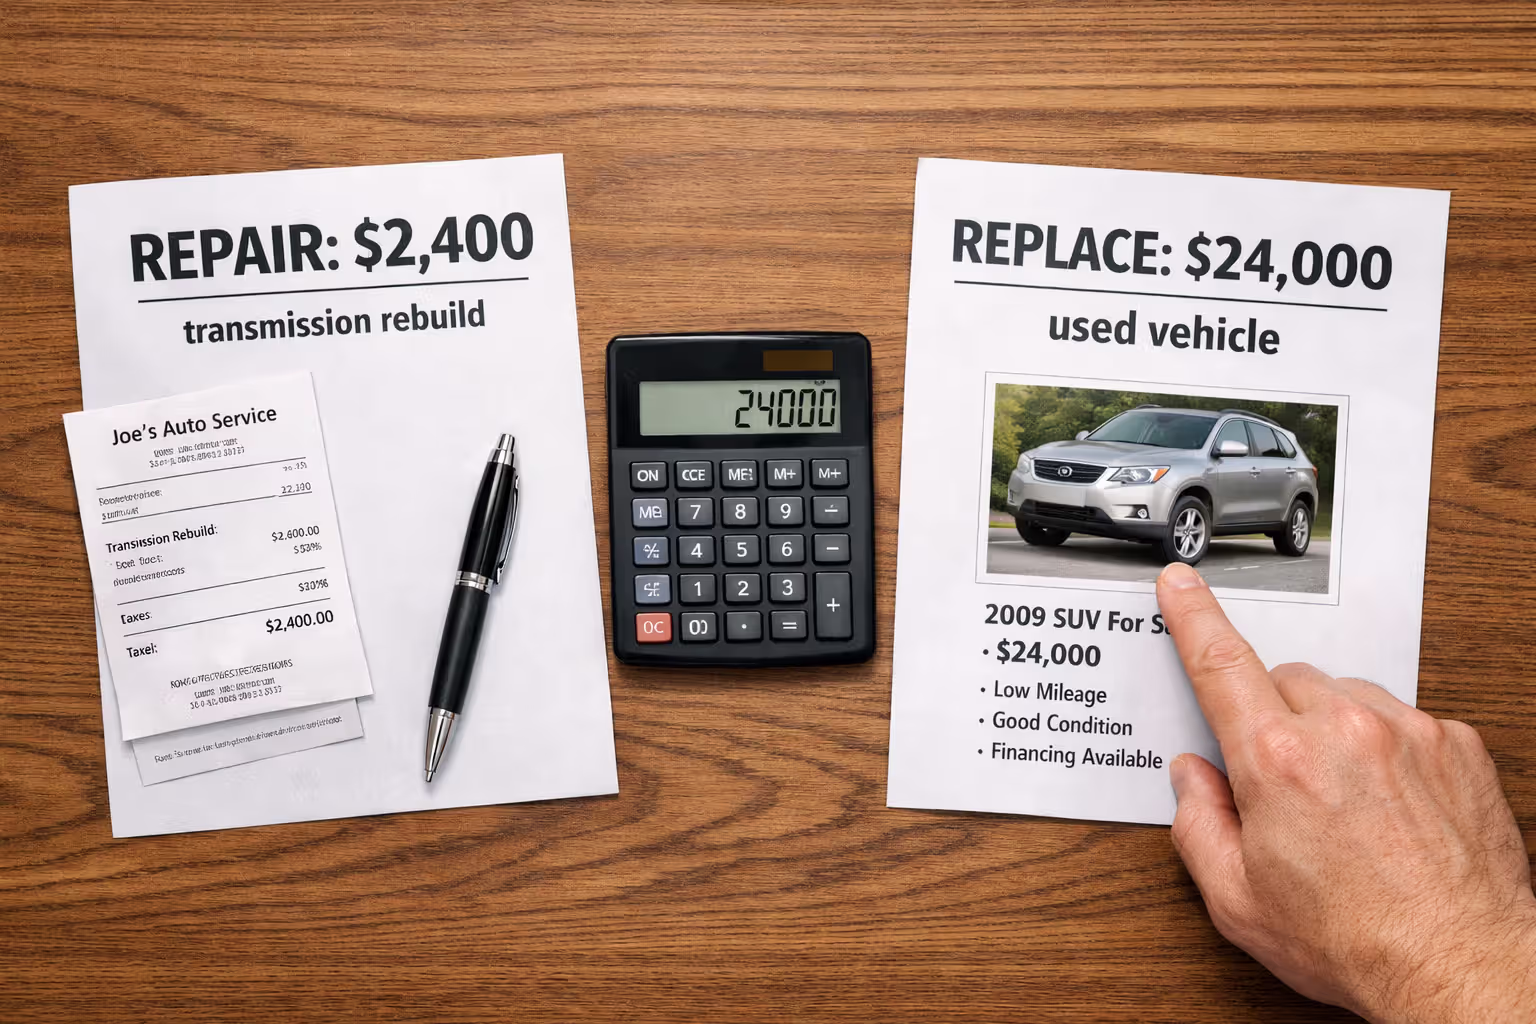
Vehicle cost analysis becomes particularly valuable at repair decision points. Your 13-year-old sedan needs a $2,400 transmission rebuild. Your tracking shows monthly costs averaging $440: $165 insurance, $135 fuel, $140 averaged maintenance and repairs over the past year. That $2,400 repair buys roughly five months of continued operation at current expense levels—assuming nothing else major breaks.
"Most people fixate on the car payment when evaluating whether they can afford a vehicle, but that payment often represents less than 40% of total ownership costs. Systematic expense tracking reveals whether a car genuinely fits your budget or quietly drains your financial progress. I've worked with clients who discovered they were spending $13,800 annually on a vehicle they'd paid off years ago—they assumed it was basically free because no loan payment existed. They weren't accounting for insurance, repairs, registration, and depreciation." — Jennifer Martinez, CFP®, Austin Financial Planning Group
— Lena Prescott
Ownership financial planning requires projecting future costs from your historical data. Spent $950 in repairs last year on an 11-year-old vehicle? Budget $1,200-$1,500 for next year as aging components fail more frequently. Maybe your tracking reveals that keeping your current car another three years will likely cost $19,500 total, while a three-year-old used replacement would run $24,000. That $4,500 premium for newer, more reliable transportation might be worth it—or might not, depending on your priorities and cash flow.
Watch your data for these warning signals:
- Fuel economy declining 10%+ over six months with no change in driving patterns (mechanical issues developing)
- Repair bills exceeding two months' car payments within a single quarter (reliability deteriorating)
- Total cost per mile approaching or exceeding $1.00 for a sedan, $1.20 for an SUV (economic viability questionable)
- Insurance premiums climbing faster than general inflation (claims affecting your rates, or credit score issues)
Common Tracking Mistakes That Skew Your Numbers
Inconsistent logging habits: Recording expenses religiously for three weeks, skipping five weeks, resuming for ten days, then abandoning the effort creates worthless data. You can't calculate meaningful averages or identify trends from scattered, incomplete information. If manual tracking proves too burdensome, automate it with an app before giving up entirely.
Dismissing small expenses as irrelevant: Skipping the $4 car wash, $12 parking garage fee, and $3 air freshener because individually they seem insignificant? You're missing $400-$700 annually. These add up to $35-$60 monthly—material enough to matter in any household budget.
Excluding depreciation from calculations: Your vehicle sheds value whether you acknowledge it or not. Skip depreciation and your cost-per-mile calculations understate reality by $0.15-$0.30 per mile. Check online valuation tools quarterly to estimate current value, or apply simplified depreciation rules: new vehicles lose 15-20% year one, 10-15% annually years 2-5, then 5-10% yearly afterward.
Tracking expenses without corresponding mileage: Recording what you spend without noting how far you drove makes per-mile analysis impossible. You can't distinguish "I'm spending more because I'm driving more" from "my costs are genuinely increasing at an alarming rate."
Mixing personal and business vehicle use without separation: Use your car for work? Track business mileage separately from personal. The IRS allows a $0.655 per mile deduction (2023 rate) for qualifying business use, but you'll need documented proof. Maintain a simple log: date, starting point, destination, business purpose, miles driven. Don't mix this with personal trips.
Lumping everything into one generic category: Tossing all expenses into a bucket labeled "car stuff" prevents useful analysis. Can't reduce spending if you don't know whether the problem stems from excessive fuel consumption, expensive repairs, or overpriced insurance coverage.
Quitting after eight weeks: Two months of tracking captures none of your semi-annual insurance payment, annual registration, winter tire changeover, or that major 60,000-mile service. You need twelve full months of data to understand true costs and account for all irregular expenses.
Forgetting opportunity costs in major decisions: Your vehicle ties up capital that could generate returns elsewhere. A $28,000 car represents $28,000 not invested in index funds historically returning 10% annually. While you don't need to track this daily, factor it into major decisions like whether to pay cash or finance, or whether to pour money into an aging vehicle versus replacing it.
Author: Lena Prescott;
Source: shafer-motorsports.com
FAQ: Tracking Car Expenses
Tracking car expenses transforms vehicle ownership from a financial black box into a managed, understood budget category. Your chosen method—spreadsheets, apps, hybrid systems, even paper logbooks—matters far less than maintaining consistency for at least one full year.
Your collected data will surface uncomfortable realities about actual vehicle costs, but knowledge enables smarter decisions. You might discover that your 50-minute commute costs $11 daily in fuel and accelerated wear, suddenly making that $450 apartment closer to work financially viable. Or you'll find that repairing your current vehicle for another 24 months costs $6,800 less than replacing it, despite the occasional inconvenience of shop visits.
Start simple rather than comprehensive. Track only fuel for the first month. Add maintenance the second month. Layer in insurance and registration during month three. Build the habit before perfecting your system. Within six months you'll possess actionable data that most drivers never collect—and the financial clarity to make vehicle decisions aligned with your broader financial goals rather than vague assumptions about what transportation "should" cost.
Related Stories

Read more
Read more


The content on Auto Insights is provided for general informational and educational purposes only. It is intended to offer guidance on car buying, vehicle ownership, finance, insurance, EVs, maintenance, accessories, reviews, and related topics, and should not be considered professional financial, legal, insurance, mechanical, or investment advice.
All information, tools, calculators, comparisons, and recommendations presented on this website are for general guidance only. Individual financial situations, driving habits, vehicle conditions, insurance policies, and market factors vary, and actual results or costs may differ from estimates provided.
Auto Insights makes no guarantees regarding accuracy, completeness, or current applicability of the information, as automotive markets, regulations, incentives, interest rates, and vehicle specifications may change over time.